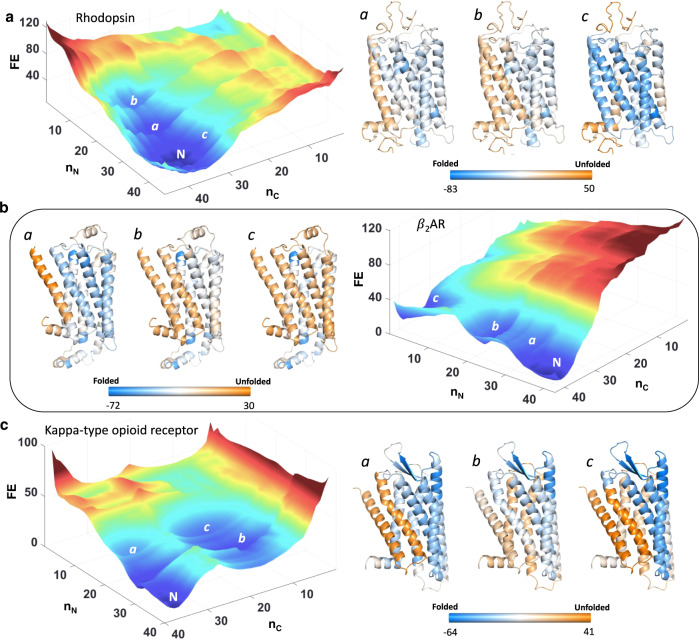
Fig. 3. GPCR conformational landscapes and native ensemble heterogeneity.
Free energy landscapes of Rhodopsin (a), β2AR (b), and Kappa-type opioid receptor (c). The free energy values and the color bars are in units of kJ mol−1. The structures are color coded according to the color bars with light blue and dark orange representing fully folded and fully unfolded conformational status, respectively. Intermediate free energy values colored in white represent regions of intermediate stability. The major conformational states a, b, and c are shown adjacent to the free energy landscapes with N representing the folded native ensemble. Source data are provided as a Source data file.

