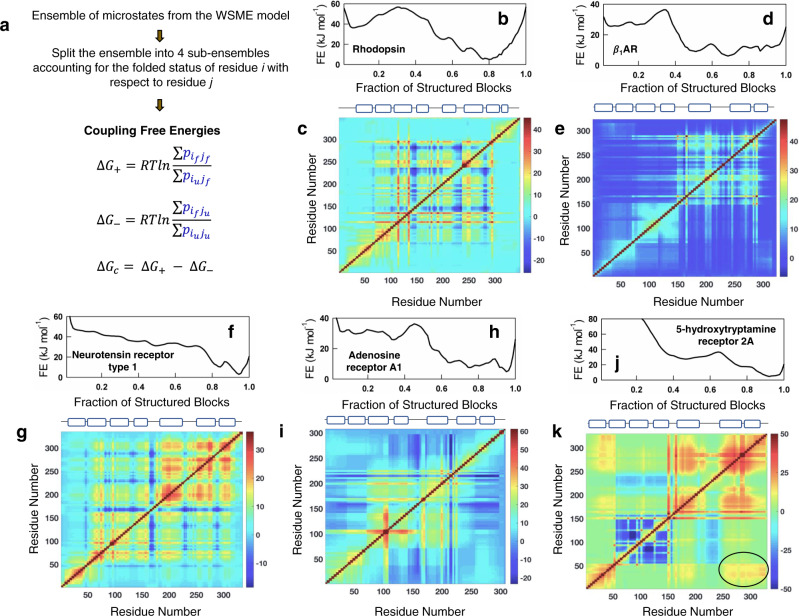
Fig. 4. Thermodynamic architecture of GPCRs.
a A flow chart describing the methodology employed to calculate coupling free energies from the microstate populations. b, d, f, h, j One-dimensional free energy profiles at 310 K. c, e, g, i, k The corresponding effective coupling free energy (∆Gc) matrices. The color bars are in the spectral scale and in units of kJ mol−1, with dark red and dark blue representing strong and weakly coupled residues, respectively. The cartoons on top indicate the position of the secondary structure elements along the sequence. The oval in k highlights that the TM helices 1 and 7 are strongly coupled in 5-hydroxytryptamine receptor 2A. Source data are provided as a Source data file.

