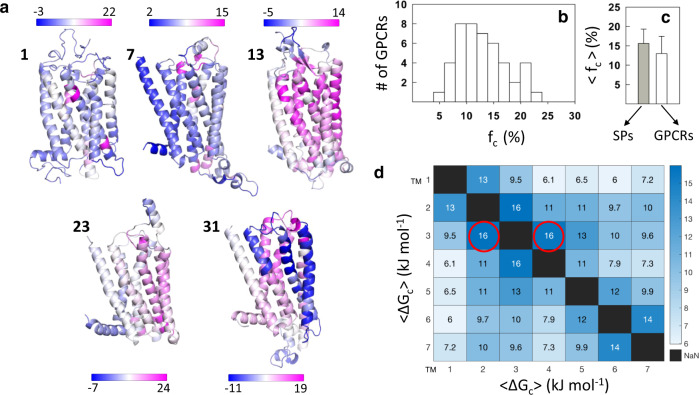
Fig. 5. Anisotropic distribution of coupling free energies.
a The mean effective coupling free energy from the matrices in Fig. 4 are mapped on the structure of GPCRs. The GPCR indices are provided for reference. Color bars are in units of kJ mol−1. Regions of the protein colored in dark magenta represent strongly coupled residues while those in dark blue are not coupled. b Distribution of the fraction of strongly coupled residues (fc) in GPCRs (n = 45). c Comparison of the mean fraction of strongly coupled residues in GPCRs (n = 45; 13.0 ± 4.5) and soluble proteins (SPs, n = 25; 15.7 ± 3.7). Data are presented as mean values ± one standard deviation. d Effective coupling free energies between transmembrane (TM) helices averaged over the 45 GPCRs. The mean standard deviations in 〈∆Gc are of the order of 4–6 kJ mol−1, indicating significant variability. Despite this variability, TM3 turns out to be strongly coupled to every other TM helix. Source data are provided as a Source data file.

