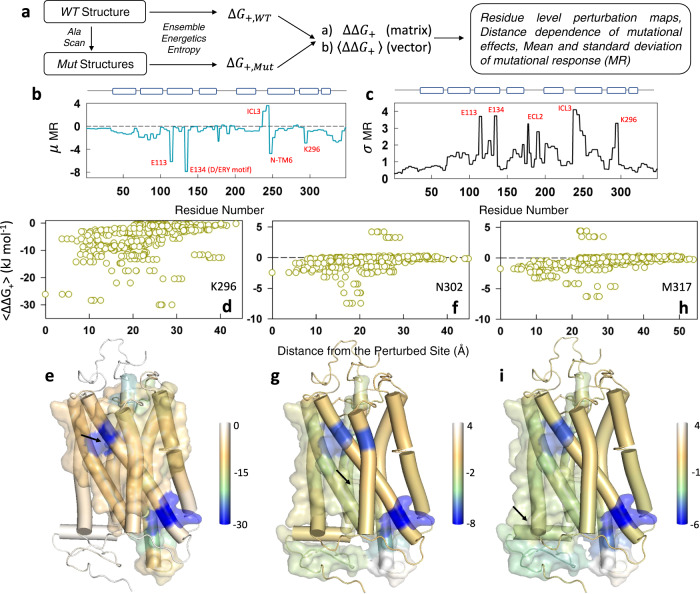
Fig. 7. Alanine-scanning reveals long-range communication in Rhodopsin.
a Protocol employed for in silico alanine-scanning mutagenesis studies from the perspective of the WSME model. b, c Mean (b) and standard deviation (c) of the mutational response (MR in kJ mol−1). Specific residues and structural regions are highlighted for discussion in the main text. E113 and K296 are in the retinal binding pocket while E134 forms a part of the conserved D(E)RY motif that interacts with the G-protein. N-TM6 represents the N-terminal region of TM6. d, e Perturbation response of K296 quantified by 〈∆∆G+〉 as a function of Cα-distance from the mutated site (d). values are mapped on to the structure in e following the color code shown to the right. Residues that exhibit a value stronger than the average are represented in the surface mode. Arrow points to the location of the residue that is perturbed. f–i Same as d, e for N302 (f, g) and M317 (h, i), respectively. Source data are provided as a Source data file.

