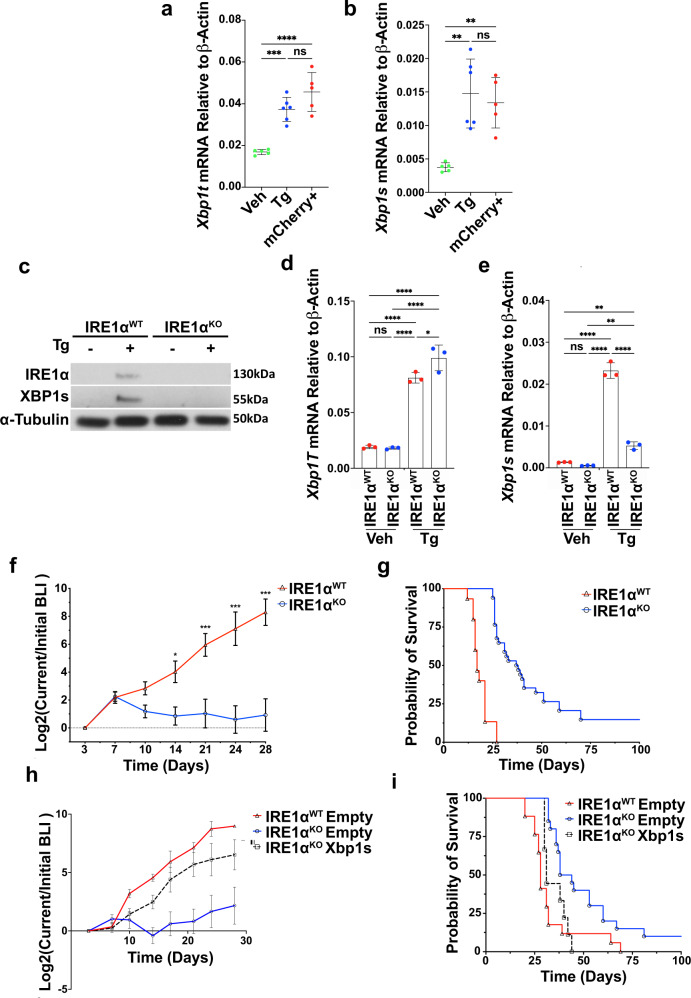
Fig. 2. IRE1α deficiency in the cancer cell impairs HKP1 tumor growth and extends host survival.
a, b RT-PCR of total Xbp1 (b, Veh vs Tg, P = 0.0004; Veh vs mCherry, P < 0.0001; Tg vs mCherry, P = 0.111) and Xbp1s (c Veh vs Tg, P = 0.001; Veh vs mCherry, P = 0.0042, Tg vs mCherry, P = 0.8234), in vehicle (n = 5), or 1 µM Tg for 6 h (n = 3) and mCherry+ HKP1 cells from tumors (n = 5). Data were presented as mean ± SD. Tg Thapsigargin. One-way ANOVA with Tukey’s multiple comparisons test for ratios; *P < 0.05, **P < 0.001, and ***P < 0.0001. c Western blot of IRE1α and XBP1s in IRE1αWT or IRE1αKO HKP1 cells treated with vehicle or 1 μM Tg for 6 h. This result represents three replicates. d, e RT-PCR for of Xbp1 total (e Veh WT vs Tg WT, P < 0.0001; Veh WT vs KO Veh, P = 0.9970; Veh WT vs KO Tg, P < 0.0001; Tg WT vs KO Veh, P < 0.0001; Tg WT vs KO Tg, P = 0.0343; KO Veh vs KO Tg, P < 0.0001), Xbp1s (f Veh WT vs Tg WT, P < 0.0001; Veh WT vs KO Veh, P = 0.7959; Veh WT vs KO Tg, P = 0.0071; Tg WT vs KO Veh, P < 0.0001; Tg Wt vs KO Tg, P < 0.0001; KO Veh vs KO Tg, P = 0.0023) in IRE1αWT or IRE1αKO HKP1 cells treated with vehicle (n = 3) or 1 μM Tg (n = 3) for 6 h. One-way ANOVAs with Tukey’s multiple comparisons test; *P < 0.05, **P < 0.001, and ***P < 0.0001. Data were shown as mean ± SD. f BLI plots of longitudinally tracked in vivo IRE1αWT (red, n = 6) vs IRE1αKO (blue, n = 10) HKP1 tumors (Day 3, P = NS; Day 7, P = NS; Day 10, P = NS; Day 14, P = 0.0275; Day 21, P = 0.0002; Day 24, P < 0.0001 and Day 28, P < 0.0001). Data were shown as mean ± SEM of biological replicates. Analyses of different time points in tumor progression were performed using two-way ANOVA with Tukey’s multiple comparisons test; *P < 0.05, **P < 0.001, ***P < 0.0001. g Kaplan–Meier plots showing the probability of overall survival in IRE1αWT (red, n = 15) vs IRE1αKO (blue, n = 35) HKP1 tumor-bearing mice (P < 0.001). Tumors were allowed to progress until endpoint and survival were evaluated using Mantel–Haenszel Log-rank-test). h BLI plots of longitudinally tracked in vivo IRE1αWT empty vector (red, n = 5), IRE1αKO empty vector (blue, n = 5) and IRE1αKO expressing Xbp1s cDNA (black, n = 5) HKP1 tumors. Data were shown as mean ± SEM of biological replicates. Data were pooled from two independent experiments. (P < 0.001 for IRE1αWT vs. IRE1αKO; P < 0.002 for IRE1αKO vs. IRE1αKO expressing Xbp1s cDNA at day 28). Data were shown as mean ± SEM of biological replicates. Analyses of different time points in tumor progression were performed using two-way ANOVA with Tukey’s multiple comparisons test. i Kaplan–Meier plots showing overall survival in IRE1αWT (red, n = 17), IRE1αKO (blue n = 20), and IRE1αKO expressing Xbp1s cDNA (black, n = 9). Tumors were allowed to progress until endpoint and survival were evaluated using Mantel–Haenszel Log-rank-test). Data were pooled from two independent experiments. (P = 0.0009 for IRE1αWT vs. IRE1αKO; and P = 0.0058 for IRE1αKO vs. IRE1αKO Xbp1s. Source data are provided as a Source Data file.

