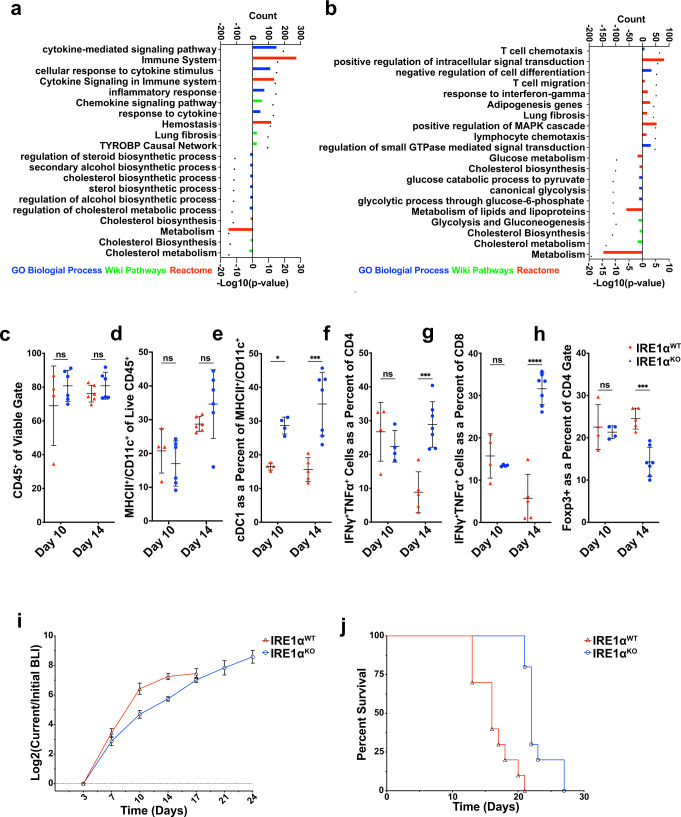
Fig. 3. Adaptive immunity mediates the protective effects of tumor cell-intrinsic IRE1α loss.
a, b Top ten upregulated and ten downregulated terms enriched from GO Biological Process (Blue), Wiki Pathways (Green) and Reactome (Red) in differentially expressed genes between IRE1αWT vs IRE1αKO mcherry+ cells from HKP1 tumors at day 10 (a) and 14 (b). Significance cutoff values were set at log2 fold-change >0.5, p value < 0.05 and false discovery rate <10%). The count of genes enriching the GO term is represented as a barplot, and the plotted –log10 p values are represented as a dot above its corresponding bar. Genes matching these criteria were analyzed using the Enrichr portal with standard parameters. c–h Box and whisker plots of flow cytometry data from IRE1αWT (red) vs IRE1αKO (blue) HKP1 tumor-bearing lungs at day 10 (n = 4 IRE1αWT and n = 6 IRE1αKO) and 14 (n = 6 IRE1αWT and n = 7 IRE1αKO), showing percent viable CD45+ (c), MHCII+ CD11C+ (d), and cDC1 (e). IFNγ/TNFα+ T cells as a percent of CD4 (f), IFNγ/TNFα+ T cells as a percent of CD8 (g), and percent of T-regulatory cells of viable CD45+ cells (h). Data were shown as mean ± SD. Two-way ANOVA with Tukey’s multiple comparisons test; *P < 0.05, **P < 0.001, and ***P < 0.000, ns non-significant. i IRE1αWT or IRE1αKO HKP1 tumor growth in Rag2-KO mice. Data were shown as mean ± SEM of biological replicates, (n = 5, per condition). Analyses of different time points in tumor progression were performed using two-way ANOVA with Tukey’s multiple comparisons test; *P < 0.05, **P < 0.001, and ***P < 0.0001; ns non-significant. j Kaplan–Meier plots showing probability of overall survival in Rag2-KO mice bearing IRE1αWT or IRE1αKO HKP1 tumors. (P < 0.001, n = 5 per condition). Source data are provided as a Source Data file.

