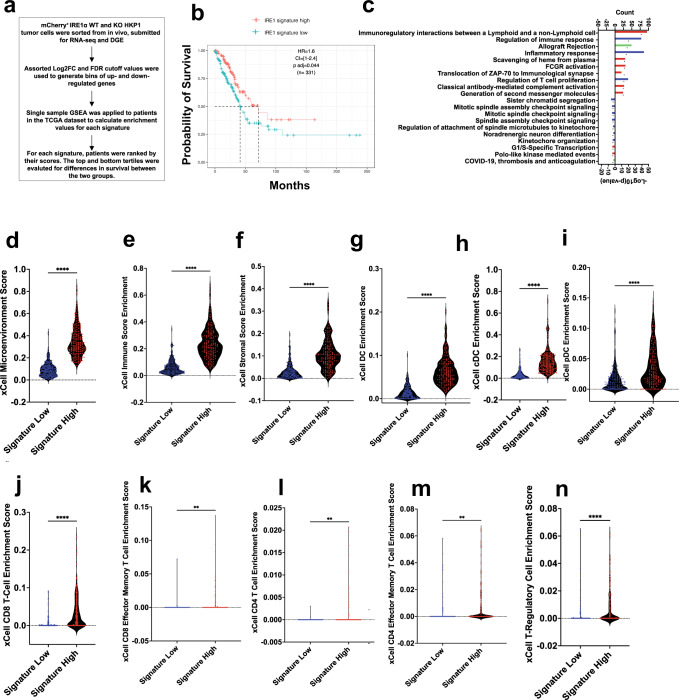
Fig. 5. IRE1αKO gene signature enrichment is associated with human LUAD survival and immune infiltration.
a Schematic depicting IRE1α signature generation and evaluation. b Kaplan–Meier survival plots depicting associations between overall survival (OS) and IRE1αKO signature status in human TCGA-LUAD. High is top 1/3rd (n = 166) and low is bottom 1/3rd (n = 165) of the IRE1αKO signature scores. HR is the hazard ratio and p adj is log-rank p value from the multivariate Cox proportional-hazards regression model. c Gene ontologies between the IRE1αKO signature high and low tertile patients. The count of genes enriching the term on the top x-axis is represented as a barplot, and the –log(10) p value for the terms on the bottom x-axis, represented as a black symbol. Exact P values are in the Source Data file. d–n Violin plots of xCell pipeline enrichment scores for microenvironment (d P < 0.0001), immune (e P < 0.0001), stromal (f P < 0.0001), DC (g P < 0.0001) cDC (h P < 0.0001), pDC (i P < 0.0001), CD8 + T cells (j P < 0.0001), Effector CD8 T cells (k P = 0.0011), CD4 T cells (l P = 0.0013), Effector CD4 T cells (m P = 0.0017), and Treg (n P < 0.0001) from the top and bottom tertiles of those with high (red, n = 169) or low (blue, n = 169) signature enrichment. Unpaired Student’s t-test, two-sided. *P < 0.05, **P < 0.001, and ***P < 0.0001. Source data are provided as a Source Data file.

