
Figure 1.
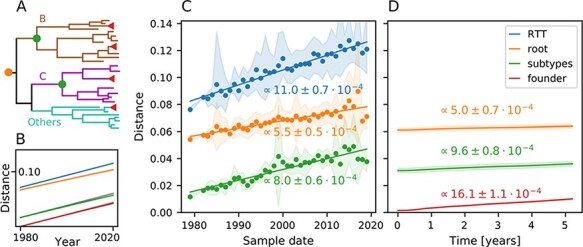
Divergence over time in the pol gene. (A) Sketch of the HIV-1 group M phylogenetic tree and its subtypes. Dots correspond to the position of the references used to compute distances in the other panels. WH evolution is indicated by red triangles. (B) Expected Hamming distances under a Jukes–Cantor (Jukes et al., 1969) evolution model with rate variation (gamma distributed, Parameter 2). Different curves show expected distance to the root of the tree (orange), subtype root (green), and WH founder (red). The blue and gray indicate linear growth of distance without saturations with a rate equal to the estimate from the root-to-tip (RTT) distance in Panel C. As expected, saturation effects are small since distances are around 10 per cent and multiple hits are rare. (C) Average Hamming distance from the root of the HIV-1 group M tree (orange), from the respective subtype (green, see dots in Panel A), or RTT distance in a phylogeny as a function of time. Each data point is the average of sequences from one year, lines are linear fits, and the shaded area indicates the 10–90 per cent range. (D) The WH divergence over time relative to the putative founder genotype, the HIV-1 group M root, and the subtype consensuses, averaged over all patients in the HIVEVO data set. Divergence is computed according to Equations (1) and (2). Standard estimates for the evolution rates BH and WH are the slopes of the RTT distance (blue) and divergence from founder sequence (red). There is an approximately 50 per cent difference between the evolution rates estimated while sequence distance is only a couple per cent. Comparing to the expectation (B), we can see that significant saturation of comparable magnitude can be seen on both BH (C) and WH (D) scales. Results for regions env and gag are shown in Supplementary Figs. S1 and S2.