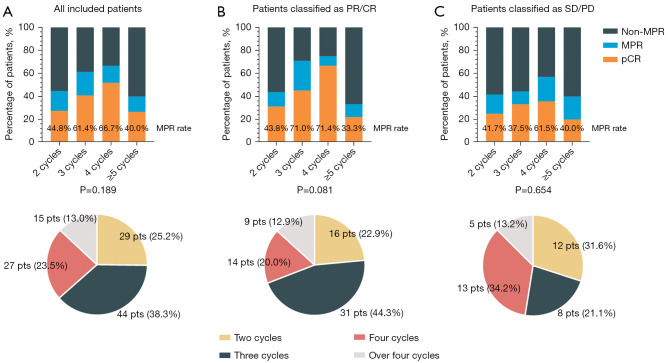
Figure 4.
The pathological response outcome stratified by the different neoadjuvant cycle numbers. (A) All included patients, (B) patients classified as PR, and (C) patients classified as SD/PD. The pie chart displays the number of patients who received different neoadjuvant cycle numbers. PR, partial response; CR, complete response; SD, stable disease; PD, progression disease; MPR, major pathological response.

