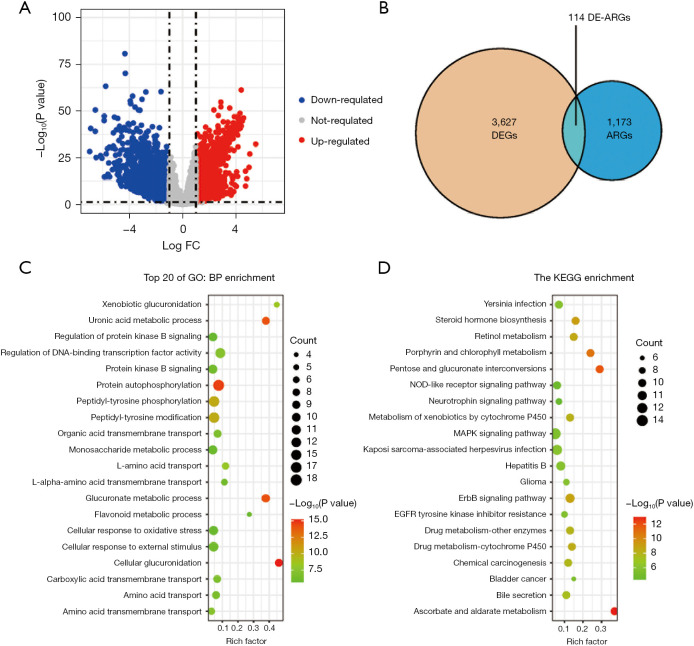
Figure 1.
Identification of ARGs. (A) Volcano plot of the DEGs in the LIHC samples and normal samples from TCGA database. (B) Venn diagram showing the overlap of the DEGs and ARGs. (C,D) GO and KEGG pathway analysis results for the differentially expressed ARGs (top 20 according to P values). FC, fold change; DEGs, differentially expressed genes; ARGs, autophagy-related genes; DE-ARGs, differentially expressed autophagy-related genes; GO, Gene Ontology; BP, biological process; KEGG, Kyoto Encyclopedia of Genes and Genomes; LIHC, liver hepatocellular carcinoma.

