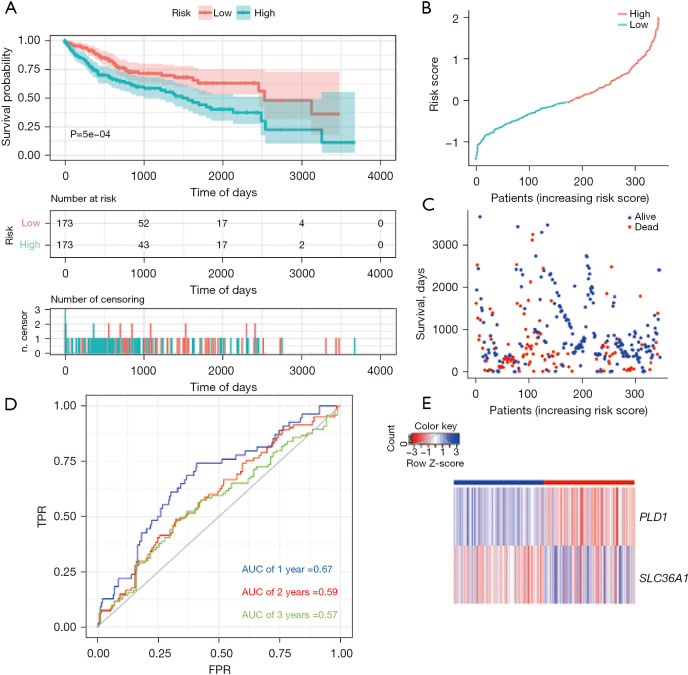
Figure 3.
Autophagy-related prognostic index of liver cancer patients in TCGA LIHC cohort (training set). (A) Kaplan-Meier plot showing that the patients in the high-risk group had a significantly shorter OS time than those in the low-risk group. (B) The distribution of risk score in TCGA data set. (C) The OS of patients in TCGA data set. (D) Comparisons of the predictive accuracy at 1-, 2-, and 3-year OS using time-dependent ROC curves in TCGA data set. (E) Heat map showing the ARG signatures of every patient in TCGA data set. TPR, true positive rate; FPR, false positive rate; AUC, area under the curve; TCGA, The Cancer Genome Atlas; LIHC, liver hepatocellular carcinoma; OS, overall survival; ROC, receiver operating characteristic; ARG, autophagy-related gene.

