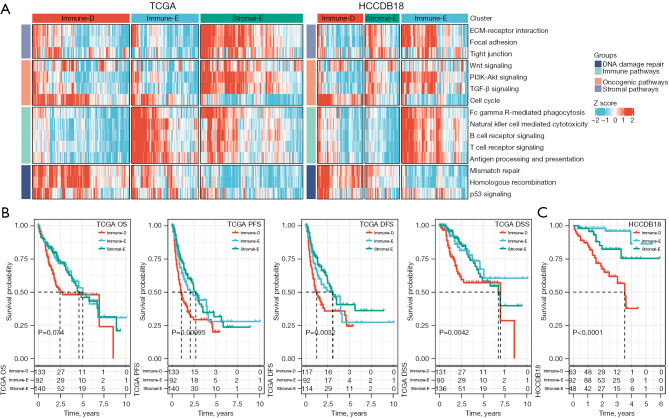
Figure 1.
The enrichment of 15 pathways and the comparison of prognosis in three clusters. (A) The heatmap showing the enrichment of 15 pathways in 3 clusters. (B) The OS, PFS, DFS, and DSS of 3 clusters in TCGA dataset. (C) The OS of three clusters in HCCDB18 dataset. Log-rank test was performed in survival analysis. OS, overall survival; PFS, progression-free survival; DFS, disease-free survival; DSS, disease-specific survival; TCGA, The Cancer Genome Atlas.

