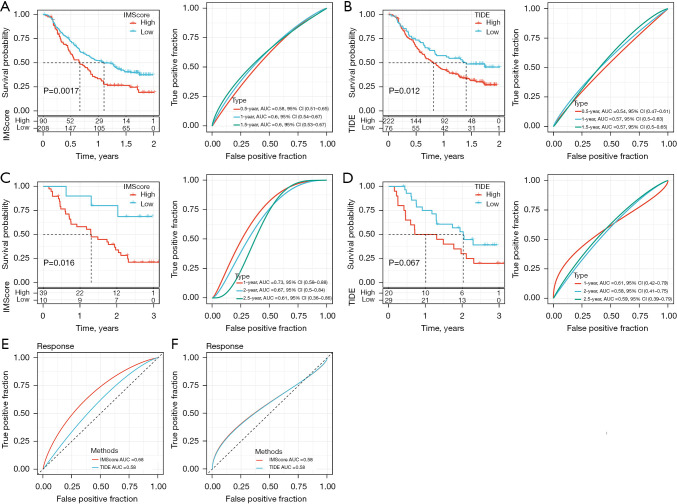
Figure 9.
The performance of the IMScore model in the patients treated with immunotherapy. (A) Survival curve and ROC curve analysis of IMScore performance in IMvigor210 dataset. (B) Survival curve and ROC curve analysis of TIDE score performance in IMvigor210 dataset. (C) Survival curve and ROC curve analysis of IMScore performance in GSE91061 dataset. (D) Survival curve and ROC curve analysis of TIDE score performance in GSE91061 dataset. (E,F) The AUC of predicting the response to immunotherapy in IMvigor210 (E) and GSE91061 (F) datasets. ROC, receiver operating characteristic; TIDE, Tumor Immune Dysfunction and Exclusion; AUC, area under the curve.

