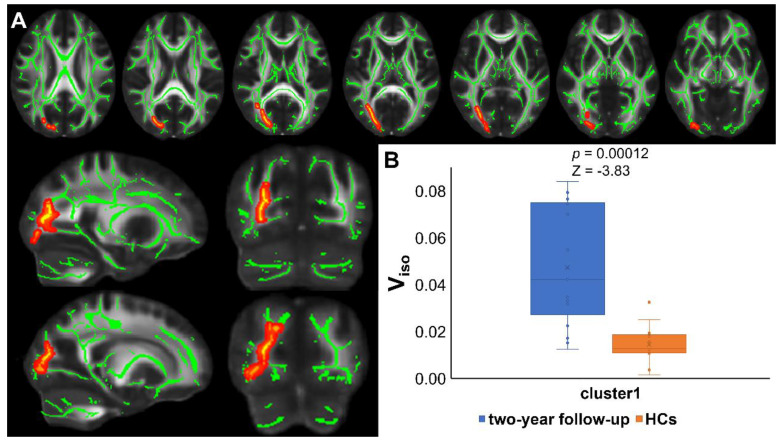
Figure 2.
Results of TBSS analysis and post hoc ROI analysis (PT2 vs HC2). (A) Tract-based spatial statistics (TBSS) results for Viso between recovered COVID-19 patients and HCs. The TBSS analyses revealed increased Viso in patients than in controls. Green represents white matter skeleton. Red-yellow represents areas of significant differences. See Table 2 for detail information of these tracts. (B) Post hoc region-of-interest (ROI) analysis results. Clusters are significant tracts in TBSS. The blue boxes represent recovered COVID-19 group, and the orange boxes represent HCs. PT2, recovered patients at two years after discharge; HC2, healthy controls in 2022; Viso, volume fraction of isotropic diffusion compartment.

