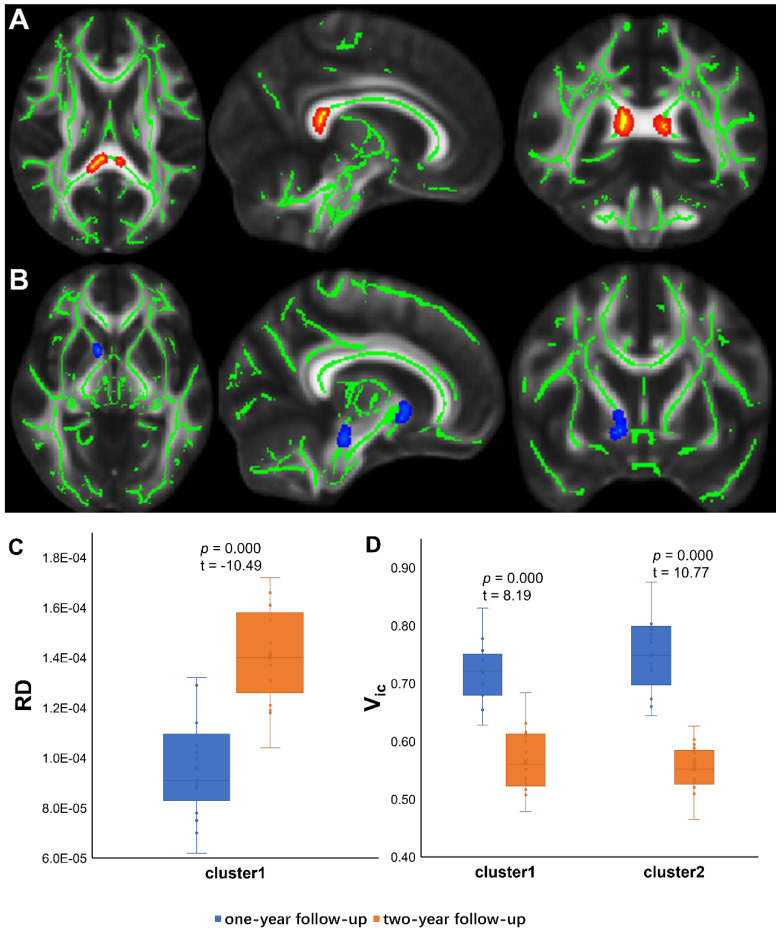
Figure 3.
TBSS Results of deteriorate diffusion metrics and post hoc ROI analysis (PT1 vs PT2). (A) Tract-based spatial statistics (TBSS) results for RD between PT1 and PT2. The TBSS analyses revealed increased RD in patients two years after discharge than in patients one year after discharge. Green represents white matter skeleton. Red-yellow represents areas of significant differences. See Table 2 for detail information of these tracts. (B) TBSS results for Vic between PT1 and PT2. The TBSS analyses revealed decreased Vic in patients two years after discharge than in patients one year after discharge. Green represents white matter skeleton. Blue-light blue represents areas of significant differences. See Table 2 for detail information of these tracts. (C) (D) Post hoc region-of-interest (ROI) analysis results. Clusters are significant tracts in TBSS. The blue boxes represent PT1, and the orange boxes represent PT2. PT1, recovered patients at one years after discharge; PT2, recovered patients at two years after discharge; RD, radial diffusivity; Vic, volume fraction of intracellular water.

