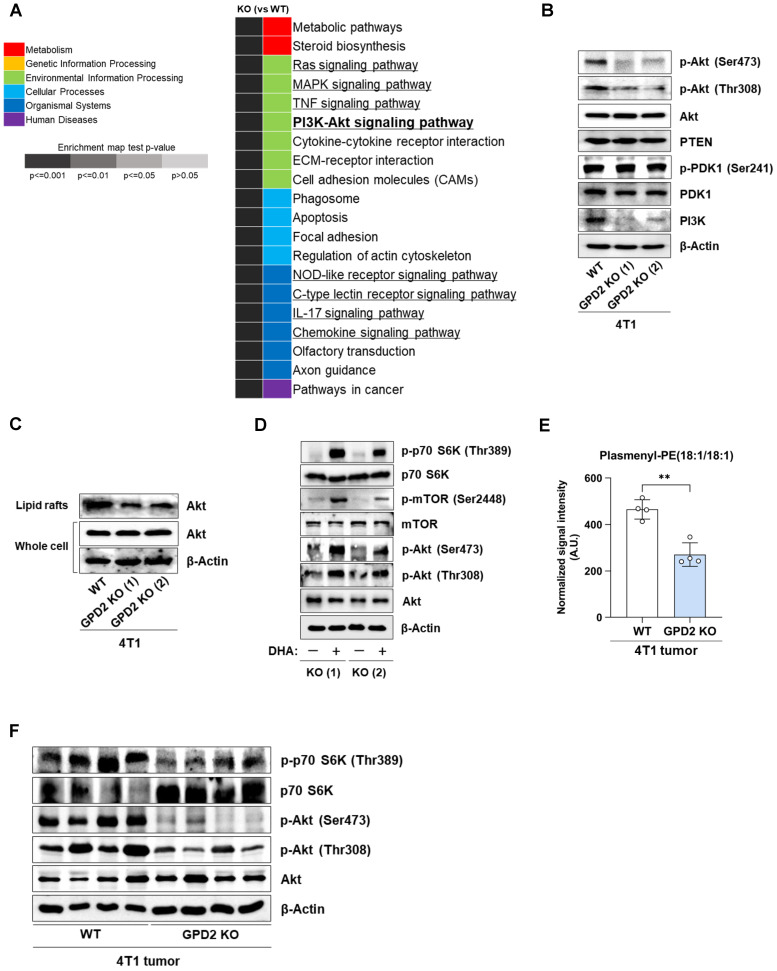
Figure 5.
GPD2 KO downregulates Akt signaling pathway, and it is recovered by DHAP supplementation. (A) List of top 20 significantly enriched pathways in 4T1 GPD2 KO (1) cell line from GSEA with KEGG pathway. The signaling pathways are marked with underlines. (B) Expression of PI3K/Akt signaling pathway components in 4T1 and 4T1 GPD2 KO cells, as detected by Western blot analysis. (C) Expression of total Akt in the whole cell and the isolated lipid rafts of 4T1 and 4T1 GPD2 KO cells, as detected by Western blot analysis. (D) Expression of Akt/mTORC1 signaling pathway components with or without DHA treatment, as detected by Western blot analysis. (E) Level of ether lipids in WT and GPD2 KO of 4T1 graft tumor tissues, as measured by LC-MS. (F) Expression of Akt/mTORC1 signaling pathway components in WT and GPD2 KO of 4T1 graft tumor tissues. Data were obtained from three biologically independent samples or four graft tumors in each group unless indicated otherwise. The p-value was calculated by comparing the experimental group with 4T1 control group using a two-tailed unpaired Student's t-test. The “*” in the graphs indicates statistically significant difference (“*”: p < 0.05; “**”: p < 0.005; “***”: p < 0.0005). A.U., arbitrary unit.

