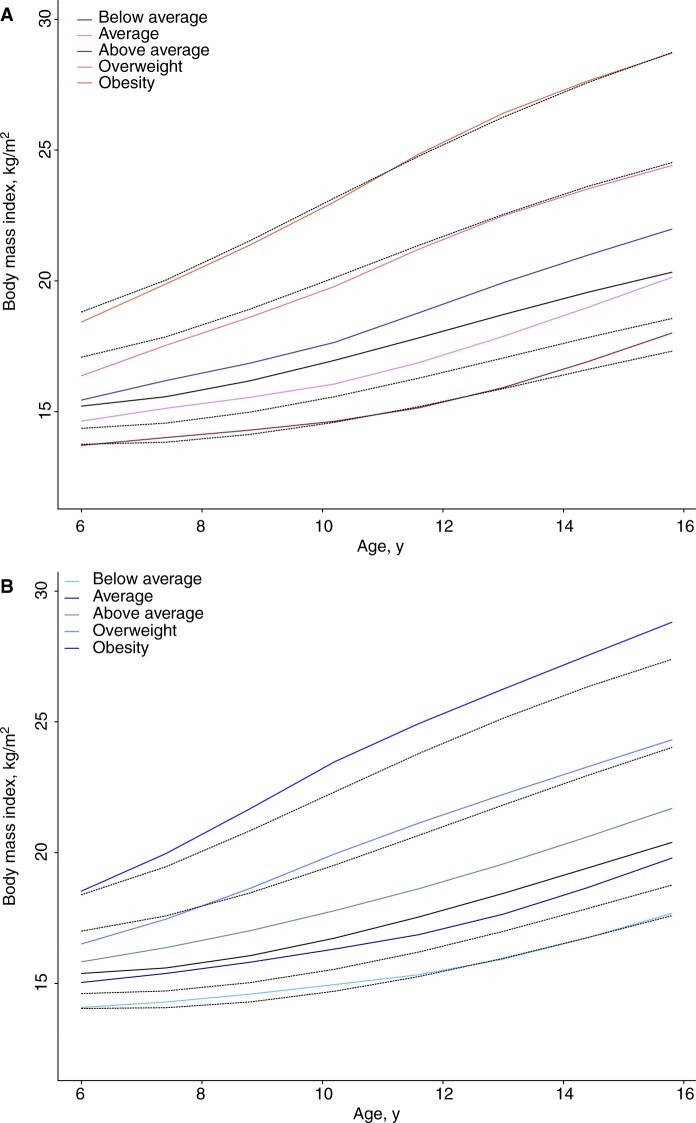
Figure 1.
Mean childhood body mass index (BMI) trajectories by sex. Shown are the estimated mean BMI trajectories for each of the identified trajectories among girls (A) and boys (B), in relation to the BMI percentiles (10th, 25th, 50th, 85th and 95th) from the US Centers for Disease Control and Prevention growth charts illustrated with the black lines. BMI = body mass index.

