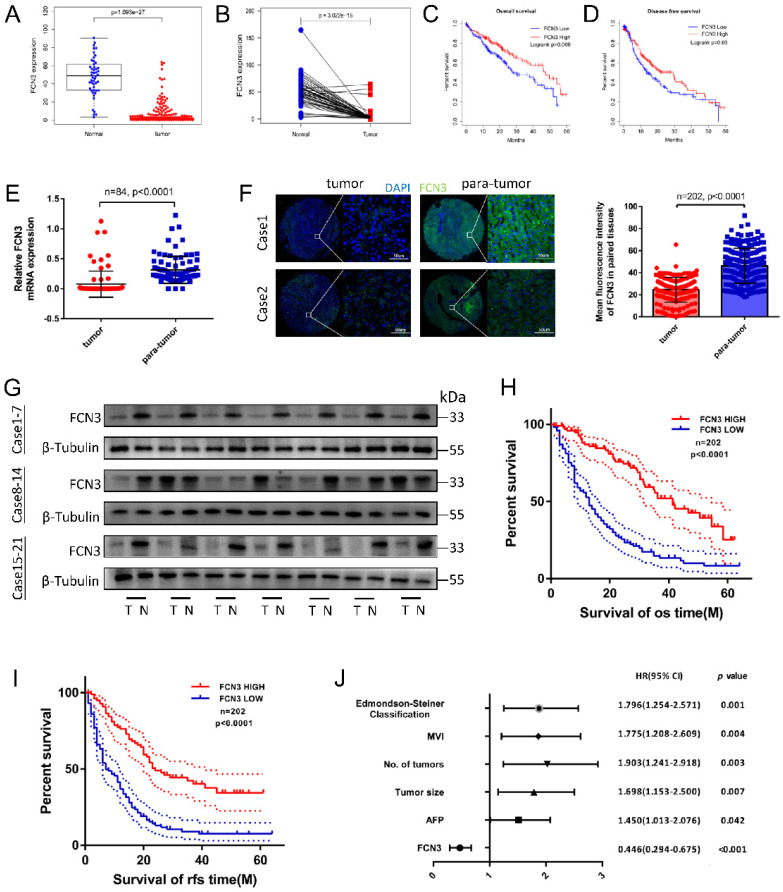
Figure 1.
Low expression of FCN3 correlated with poor prognosis. (A) FCN3 expression in 50 normal samples and 374 tumor samples from TCGA. (B) FCN3 expression in 50 pairs of HCC samples from TCGA. (C, D) Kaplan-Meier survival curves of OS and DFS of 362 patients from TCGA. (E) FCN3 mRNA expression was downregulated in tumor tissues compared to 84 paired para-tumor tissues by qRT-PCR. (F) Representative images of IF and the mean fluorescence intensity of FCN3 in 202 paired tumor and para-tumor tissues. (G) FCN3 protein expression was showed in 24 paired tumor and para-tumor tissues by Western blot. (“T” for tumor, “N” for non-tumor). (H, I) Kaplan-Meier survival curves of OS and RFS time for 202 HCC patients. (J) Forest plot of the multivariate Cox regression analysis.

