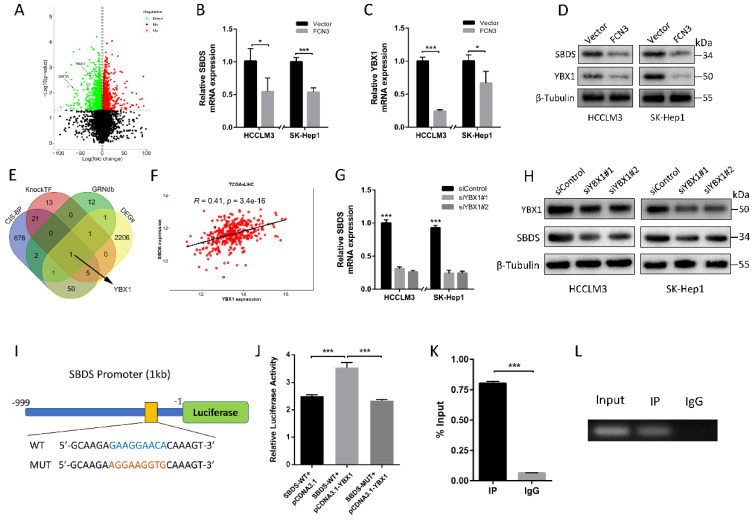
Figure 4.
YBX1 contributed to the regulation of FCN3 on SBDS. (A) Volcano map of DEGs in transcriptome sequencing. SBDS and YBX1 were marked by two black arrows respectively. (B) Relative SBDS mRNA expression in cells overexpressing FCN3 as determined by qRT-PCR. (C) Relative YBX1 mRNA expression in cells overexpressing FCN3 as determined by qRT-PCR. (D) Western blot of SBDS and YBX1 after FCN3 overexpression. (E) Venn plots of CIS-BP、KnockTF、GRNdb database and DEGs. (F) Correlation analysis of SBDS and YBX1 in TCGA-LIHC dataset. (G) Relative SBDS mRNA expression in YBX1 knockdown cells. (H) SBDS protein expression in YBX1 knockdown cells. (I) Schematic diagram of YBX1 binding site on the WT and MUT SBDS promoter. (J) Relative luciferase activity of SBDS WT and MUT promoter in HEK-293T cells. (K) ChIP-PCR assay was performed with PCR primers of SBDS promoter (%Input = 2% * 2^(CTInput - CTsample). (L) Agarose gel electrophoresis of the ChIP-PCR products. Each histogram is the mean±SD of three independent experiments. *P<0.05, ***P<0.001.

