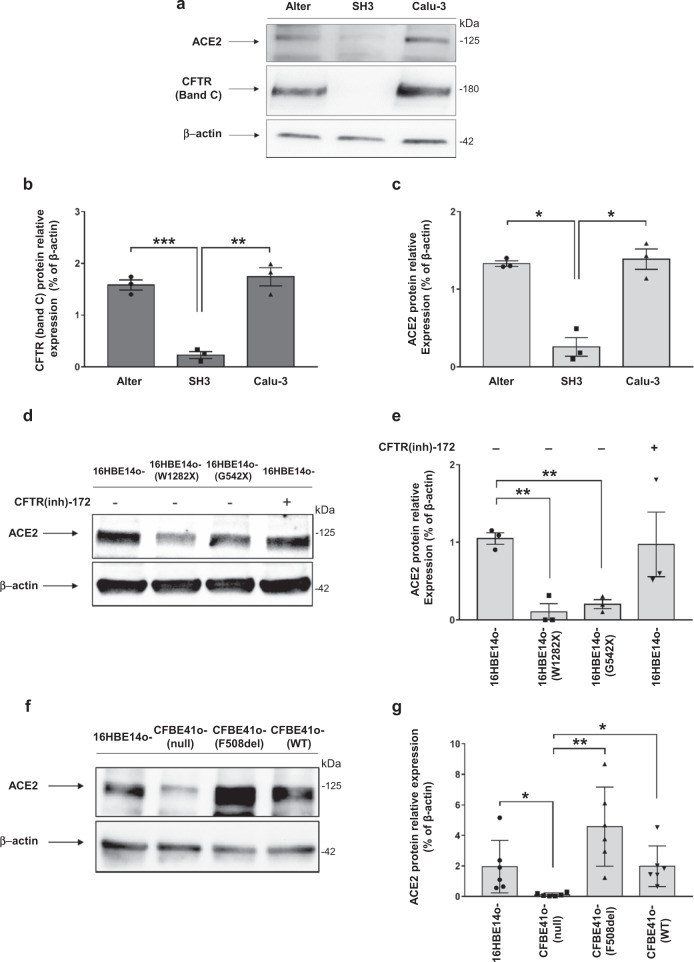
Fig. 2. CFTR expression positively correlates with ACE2 protein expression in bronchial epithelial cells.
a Representative western blot analysis of ACE2 and CFTR in Calu-3, SH3 and Alter cells. b, c Densitometry analysis of CFTR and ACE2 bands depicted in panel (a). Data are shown as the mean ± SEM of three independent experiments (n = 3). d Normal 16HBE14o- cells and gene-edited 16HBE14o- cells carrying biallelic W1282X-CFTR or G542X-CFTR mutations, grown under polarized conditions, were additionally incubated in the presence (+) or absence (−) of 5μM CFTR inhibitor CFTR(inh)-172 for 24 h. Proteins were extracted and western blot analysis was performed (representative image). e Densitometry analysis conducted in western blots as represented in panel (d). Data are shown as the mean ± SEM of three independent experiments (n = 3). f Western blot analysis on polarized CFBE41o- cells (null) and cells over-expressing the F508del- or wild-type (WT) CFTR (representative image). g Densitometry analysis conducted in western blots as represented in panel (f). Data are shown as the mean ± SEM of three independent experiments (n = 3). Normal distribution was confirmed using the Shapiro–Wilk test before running two-tailed Student’s t-test for paired data (b, c, e, g). (*p < 0.05; ** p < 0.01; ***p < 0.001). Source data are provided as a Source Data File.

