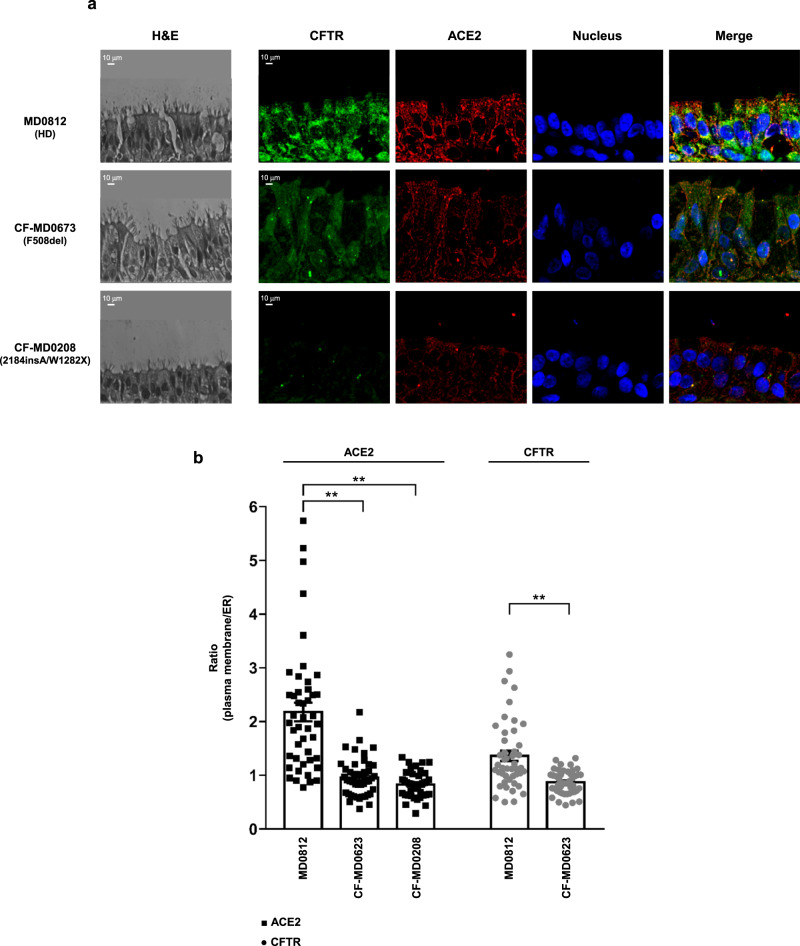
Fig. 5. Distribution of ACE2 and CFTR in primary air–liquid interface differentiated hBEC obtained from healthy donors and CF patients.
a Immunofluorescence detection of ACE2 and CFTR in primary well-differentiated hBEC obtained from an healthy donor (HD, MD0812), CF patient homozygous for F508del-CFTR mutation (CF-MD0673) and CF patient with genotype 2184insA/W1282X CFTR (CF-MD0208). H/E images have been reported to show the cell structure of primary air-liquid interface differentiated hBEC obtained from donor and CF patients. The images were acquired with a confocal laser scanner Olympus FV3000 microscope (scale bar: 10 µm). b The histogram represents the ratio between plasma membrane fluorescence and endoplasmic reticulum (ER) fluorescence of ACE2 (black) and CFTR (gray). Data are mean ± SEM of 46 cells examined over 6 independent experiments (n = 46). Normal distribution was tested by the Shapiro–Wilk test before running the two-tailed Student’s t test (b), which has been reported within the scatter plot with bars (**p < 0.01). Source data are provided as a Source Data File.

