Figure 1.
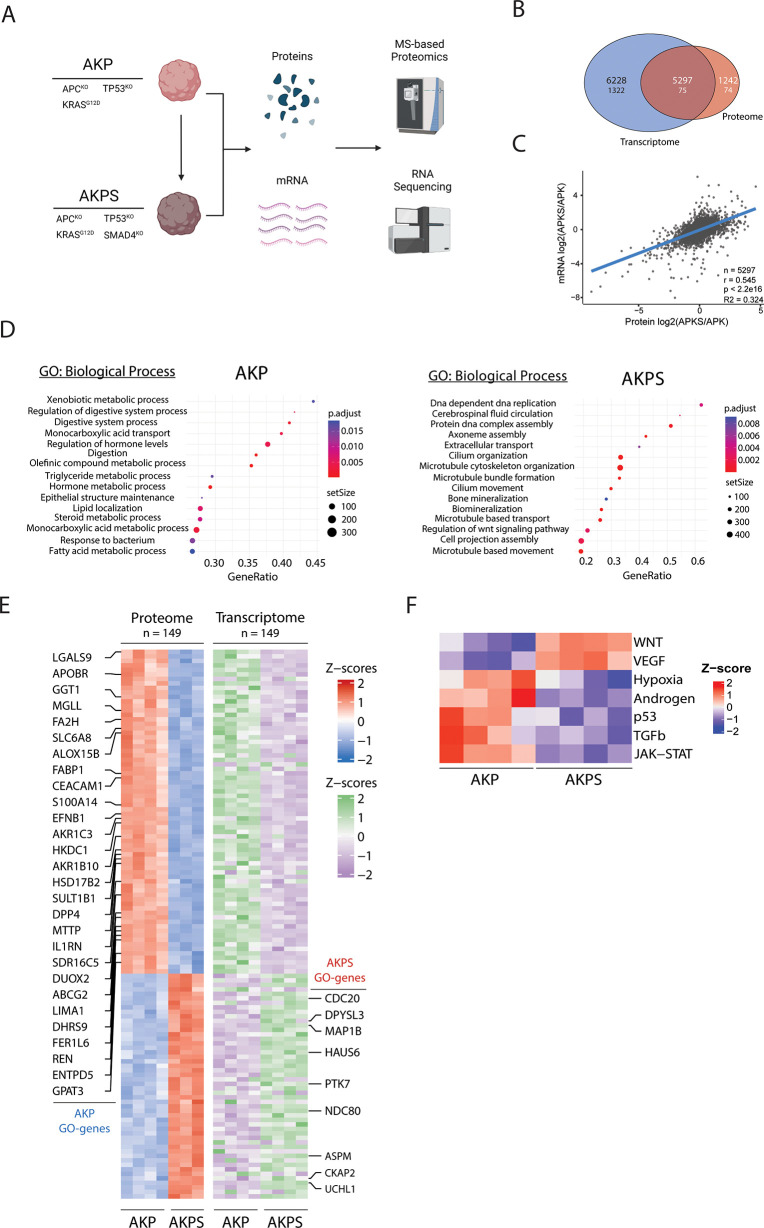
Transcriptomic and proteomic analysis of AKP and AKPS organoids. (A) Schematic overview of the used organoid lines and experimental procedures. (B) Venn diagram of detected and significant (FDR < 0.05 and FC > 2) transcriptomic and proteomic features. The upper number shows detected features, and the lower number shows significantly changing features. (C) Linear regression of relative transcriptomic and proteomic expression levels of AKP vs AKPS. n = 5297, r = 0.545, R2 = 0.324, p < 2.2 × 10⁻¹⁶. (D) Bubble plots showing the top 15 activated biological processes ranked on increasing FDR based on GSEA. All reported biological processes are over-represented with an FDR < 0.01. The left panel shows AKP-specific processes, and the right panel shows AKPS-specific processes. (E) Row-matched heatmaps showing the relative changes in protein and mRNA expression of the 149 significantly changing proteins shown in (B) (FDR < 0.05; FC > 1.5). Highlighted rows show significantly changing proteins that are associated with the biological processes in (D). (F) Heatmap showing significantly (FDR < 0.05) the relative activation of PROGENy pathways in AKP and AKPS organoids.

