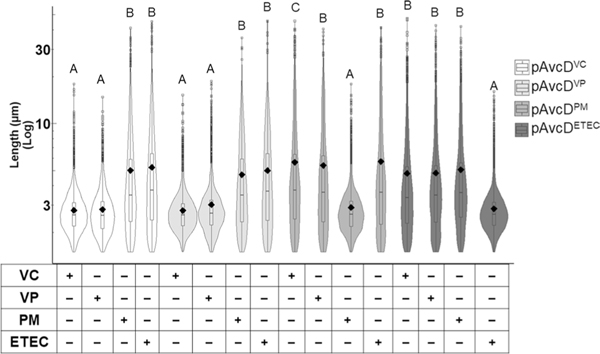
Extended Data Fig. 6 |. Cross-species inhibition of avcD and avcI homologs.
Cell length distributions of E. coli co-expressing various combinations of Ptac-inducible plasmids encoding homologs of avcD and avcI. All cell length distributions represent ~1000–3000 cells measured per strain (n = 3 biological samples), with summary statistics: mean (diamonds), median (horizontal black line), interquartile range (box), and data below and above the interquartile range (vertical lines). Different letters indicate significant differences at p < 0.05, according to Two-way ANOVA with Tukey’s post-hoc test. VC = Vibrio cholerae, VP = Vibrio parahaemolyticus, PM = Proteus mirabilis, ETEC = E. coli ETEC.

