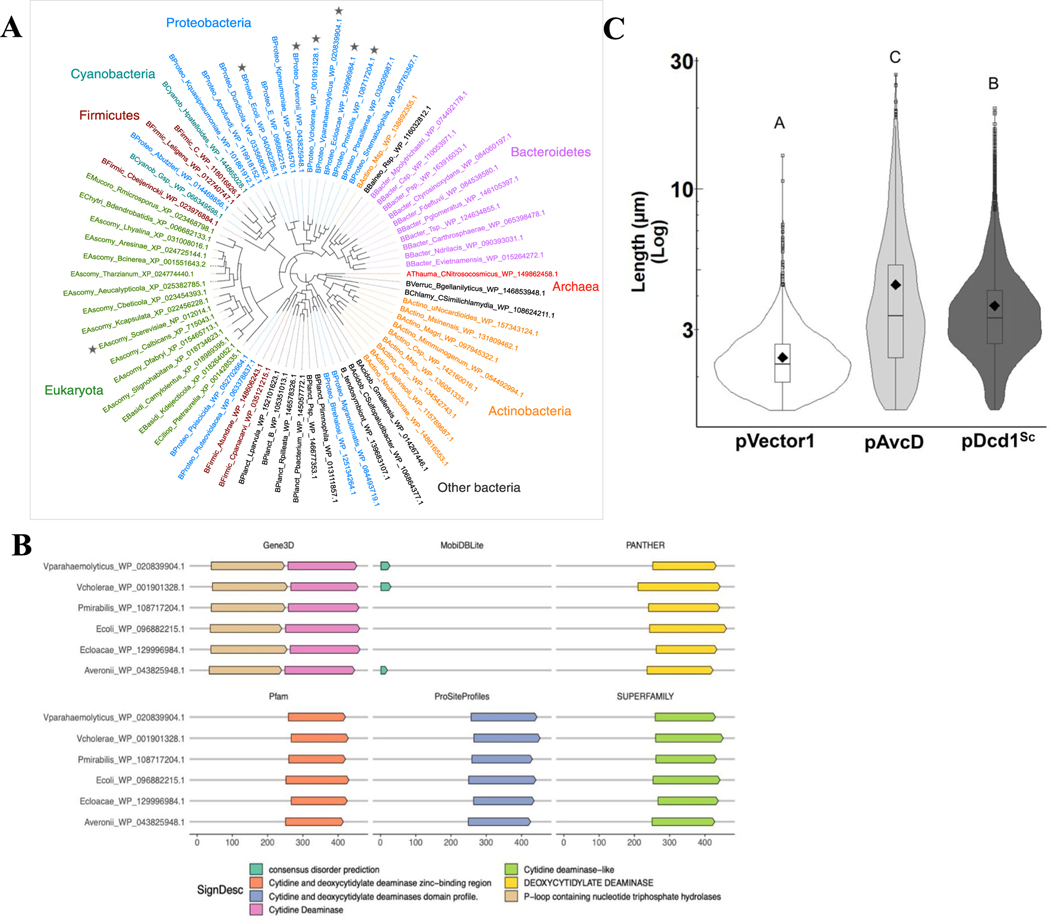
Extended Data Fig. 7 |. Phylogenetic analysis and domain architectures of the six AvcD query proteins.
(A) Phylogenetic tree of AvcD homologs from representative phyla across the tree of life. Stars indicate the six proteobacterial starting points for the homology search, as well as the eukaryotic Saccharomyces cerevisiae dcd1 (triangle). (B) Domain architecture and secondary structure predictions for the six proteobacterial starting points (query proteins) were predicted using InterProScan (Methods). Results from six main analyses are shown here for the query proteins: Gene3D (including CATH structure database), Pfam, ProSiteProfiles, PANTHER, and SUPERFAMILY protein domain profile databases, and MobiDBLite for disorder prediction. No transmembrane regions (using TMHMM) or membrane/extracellular localization were predicted for any of the proteins (using Phobius); hence not shown. Numbers (bottom) indicate the amino acid position of predicted domains and features. (C) Cell length distributions of E. coli expressing pAvcD, a Ptac-inducible plasmid encoding dcd1 from S. cerevisiae (pDcd1Sc), or pVector1. All cell length distributions represent ~1000–3000 cells measured per strain (n = 3 biological samples), with summary statistics: mean (diamonds), median (horizontal black line), interquartile range (box), and data below and above the interquartile range (vertical lines). Different letters indicate significant differences at p < 0.05, according to Two-way ANOVA with Tukey’s post-hoc test.

