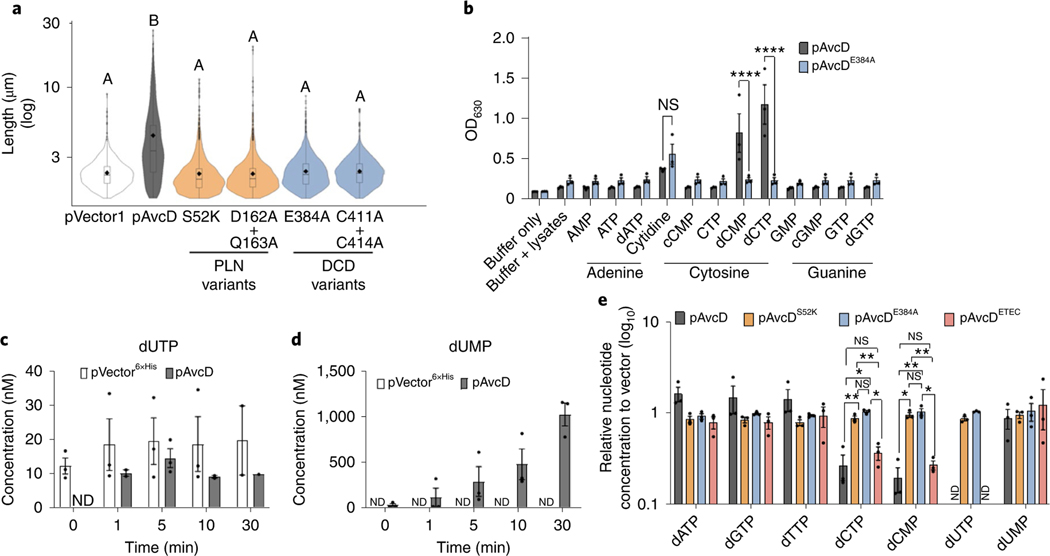
Fig. 2 |. AvcD is a DCD.
a, Cell length distributions of E. coli expressing pAvcD, Ptac-inducible plasmids encoding a variety of AvcD active-site variants, or pVector1. The violin plot represents ~1,700–3,000 cells measured per strain (n = 3 biological samples), and different letters indicate significant differences at P < 0.05, according to two-way ANOVA with Tukey’s multiple comparison post-hoc test. b, Colorimetric assay detecting the evolution of ammonium from lysates of E. coli, previously expressing pAvcD or pAvcDE384A, incubated with 12 amine-containing nucleotide substrates (37.7 mM cytidine and 7.5 mM for all other substrates) for 30 min. Data represent the mean ± s.e.m., n = 3, two-way ANOVA Šídák’s multiple-comparison test. NS, not significant. P values for dCTP and dCMP: WT versus E384A, <0.0001. c,d, Quantification of dUTP (c) and dUMP (d) using UPLC–MS/MS, in the indicated cell lysates before and after addition of 1 μM dCTP. Each bar represents mean ± s.e.m., n = 3. e, In vivo nucleotide concentrations of E. coli expressing pAvcD, AvcD active-site variants (pAvcDS52K pAvcDE384A), or an AvcD homologue (pAvcDETEC) for 1 h measured by UPLC–MS/MS and normalized to a vector control strain. Data are graphed as mean ± s.e.m., n = 3, two-way ANOVA with Tukey’s multiple-comparison test. P values for dCTP: WT versus S52K, 0.0083; WT versus E384A, 0.0193; S52K versus ETEC, 0.0019; E384A versus ETEC, 0.0236. P values for dCMP: WT versus S52K, 0.044; WT versus E384A, 0.0045; S52K versus ETEC, 0.0039; E384A versus ETEC, 0.049. ND, none detected; NS, not significant.

