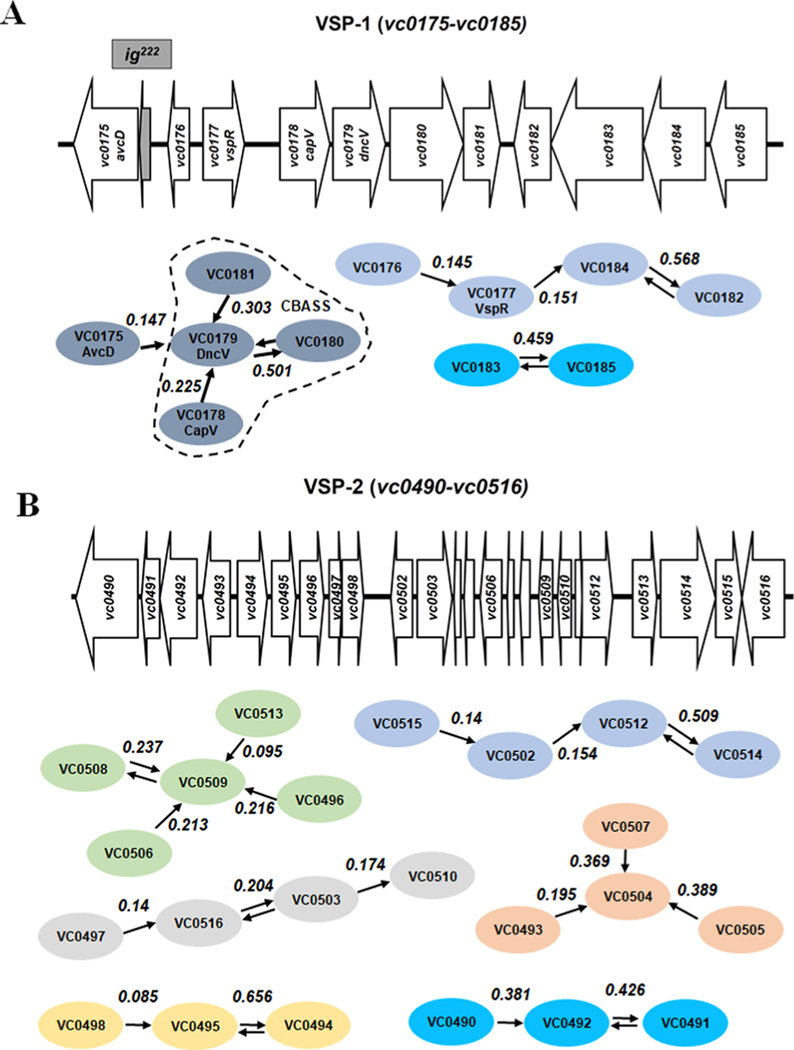
Extended Data Fig. 1 |. VSP-1 and VSP-2 schematic and predicted gene networks (MRS).
Cartoon of VSP-1 (A) and VSP-2 (B) from El Tor V. cholerae N16961 and gene network predictions from GeneCoOccurrence. Arrows indicate the highest partial correlation Wij each gene has to another (ovals). Two arrows are presented pointing in opposing directions where the highest correlation Wij is reciprocal between two genes. MRS = maximum relatedness subnetwork.

