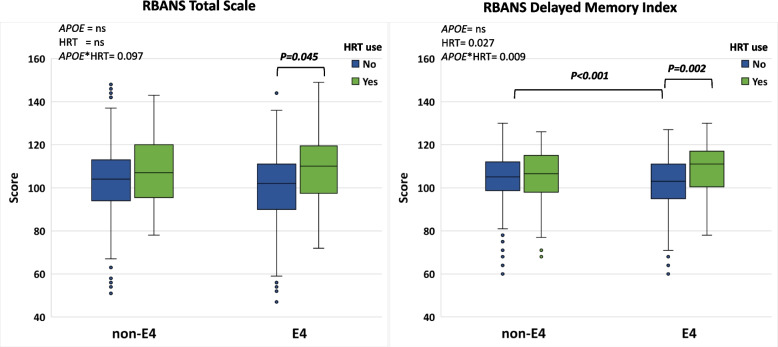
Fig. 1.
Box plots showing the mean scores of RBANS total scale (left) and RBANS delayed memory index (right) in non-APOE4 versus APOE4 stratified according to HRT use. Pairwise comparison within each genotype group was carried out on the estimated marginal mean (within the MANCOVA model), after adjustment for age, years of education, marital status, handedness, and CDR). Statistical results in the upper left corner show P values of APOE genotype, HRT, and APOE*HRT for RBANS total scale (left) and delayed memory index (right) using the MANCOVA model. Non-APOE4 n= 630 (no-HRT n=602, HRT n= 28), APOE4 n= 381 (no-HRT n=352, HRT n= 29)

