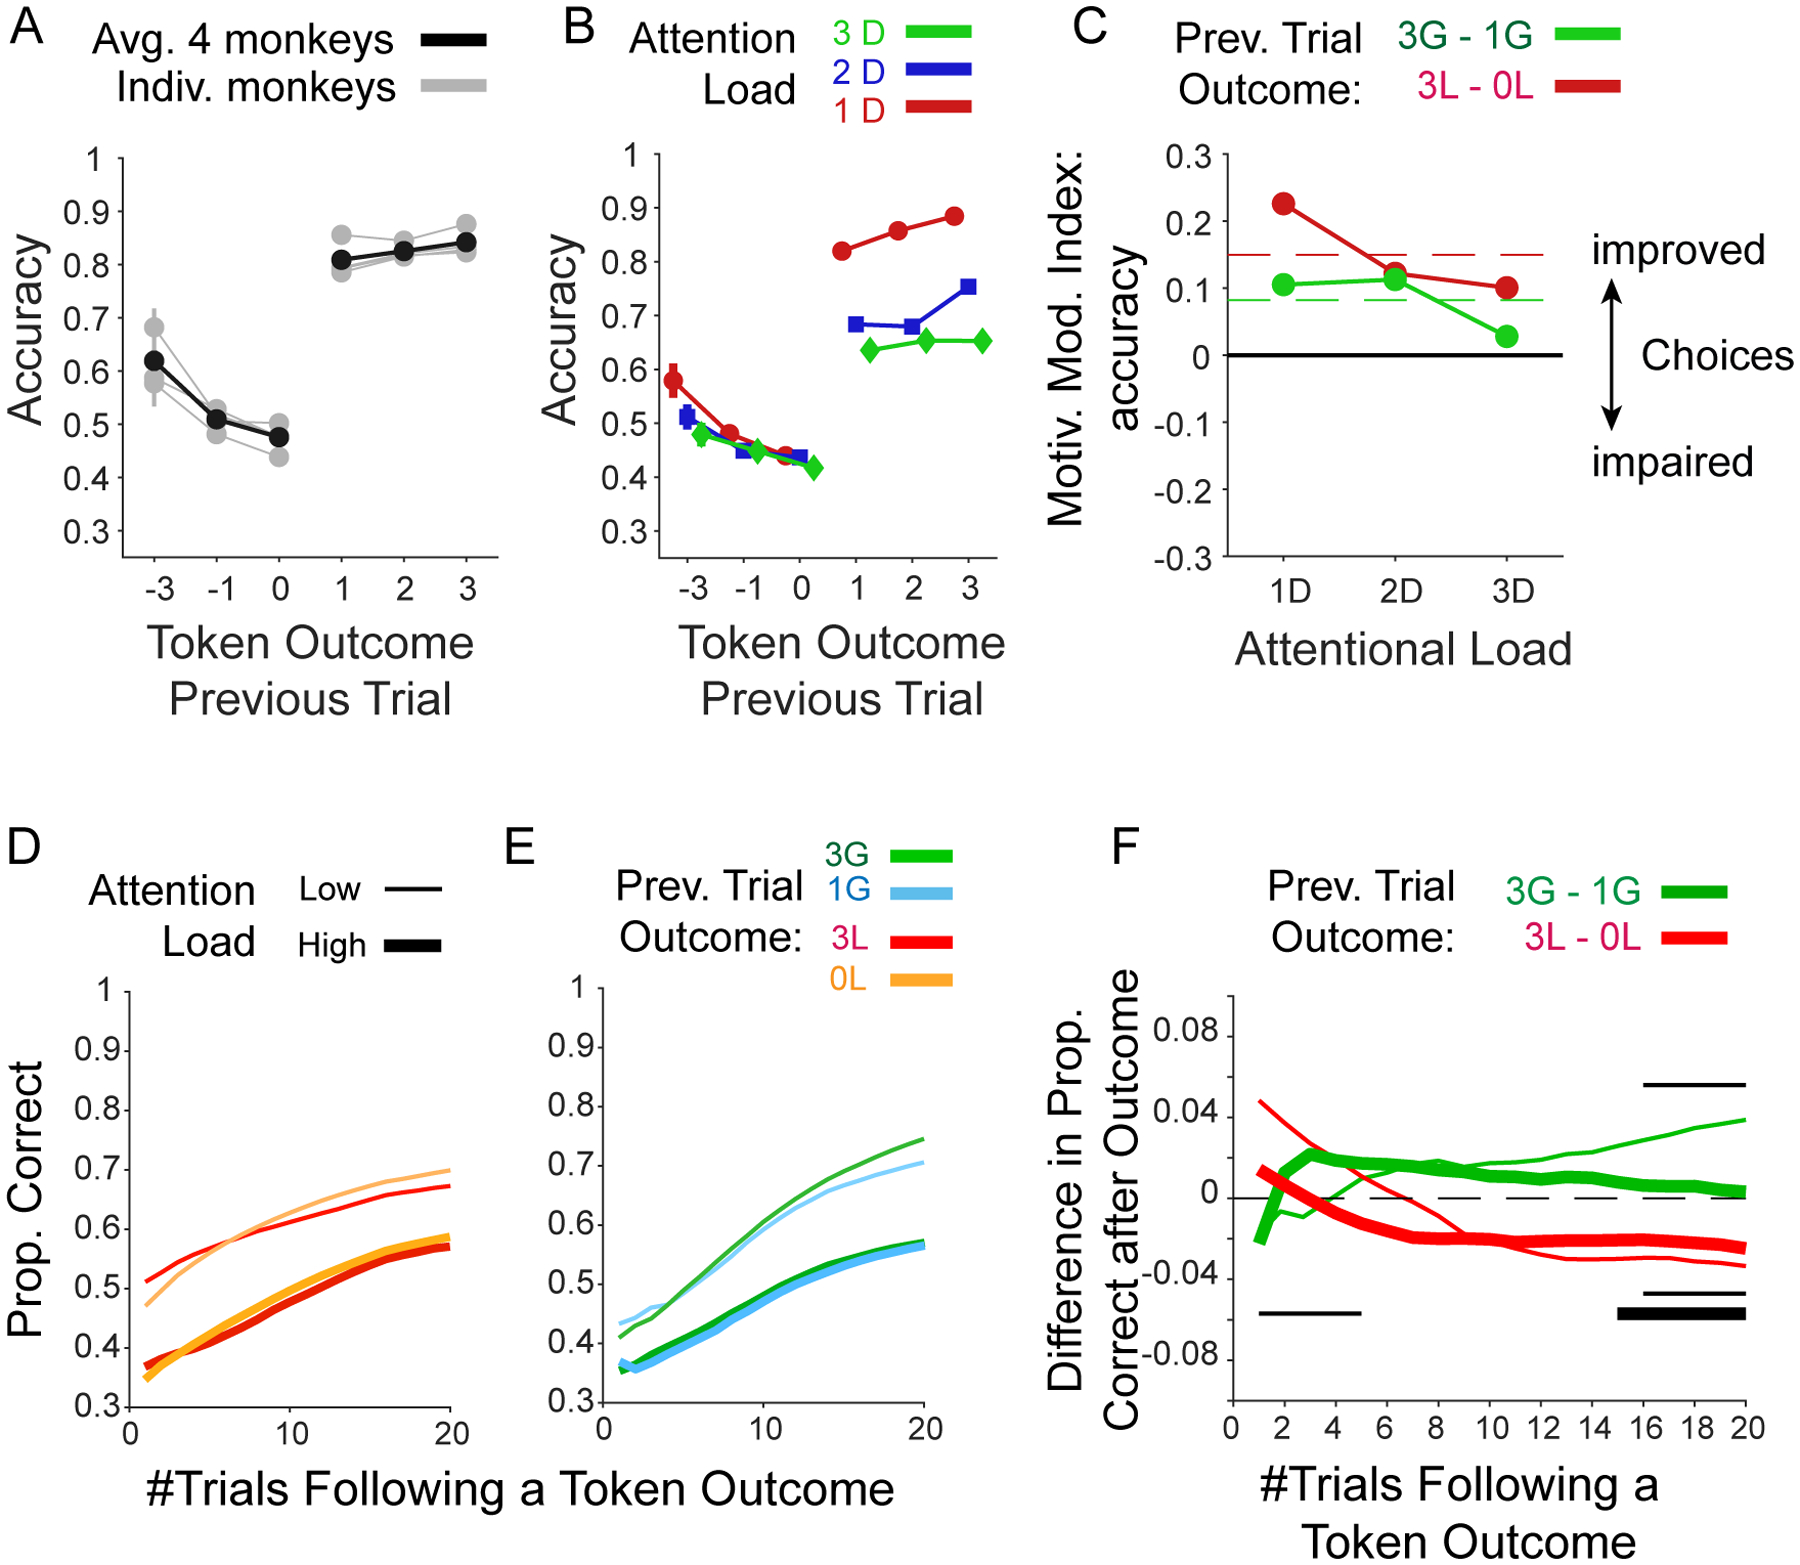
Figure 9. Effects of experienced token gains and losses on performance.

(A): The effects of an experienced loss of 3, 1 or 0 tokens and of an experienced gain of 1, 2, or 3 tokens (x-axis) on the subsequent trials’ accuracy (y-axis). Grey lines are from individual monkeys, and black shows their average. (B) Same format as A for the average previous trial outcome effects for low/medium/high attentional load. (C) Motivational modulation index (y-axis) quantifies the improved accuracy after experiencing 3 vs. 1 losses (red), and after experiencing 3 vs. 1 token gains (green) for low/medium/high attentional load. Dashed red lines show grand mean across attention load conditions. (D) The effect of an experienced loss of −3 or 0 token during learning on the proportion of correct choices in the following nth trials (x-axis). (E) Same as D but for an experienced gain of 3 or 1 token. (F) The difference in accuracy (y-axis) after experiencing 3 vs. 0 losses (red), and 3 vs. 1 token gains (green) over n trials subsequent to the outcome (x-axis). Thick and thin lines denote low and high attentional load conditions, respectively. Black thin and thick horizontal lines in the lower/upper half of the panel show trials for which the difference of accuracy (high vs. low losses/gains) was significantly different than zero, Wilcoxon test, FDR corrected for dependent samples across all trial points and low and high attentional load conditions with an alpha level of 0.05.
