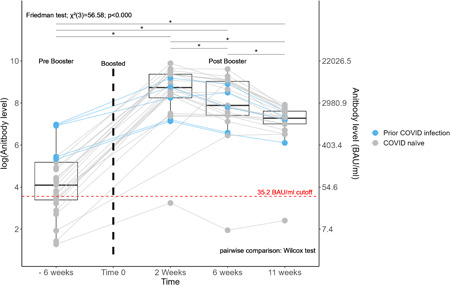
Figure 1.

Trend in antibody level over time after a SARS‐COV‐2 BNT162b2 booster. Antibody levels were measured before and at an average of 2, 6, and 11 weeks after a SARS‐COV‐2 BNT162b2 booster vaccine in 27 patients. Each dot represents a subject and each line represents a single patient trend. The center line of each box plot represents the median. The lower and upper lines represent the 25th and 75th quartile, respectively. Friedman test was used for overall testing and Wilcoxon's signed rank test for pairwise comparison, as illustrated. *Represents a statistically significant difference in antibody level between two time points. Points under the red dashed line were below the borderline/negative cutoff for antibody level protection. SARS‐CoV‐2, severe acute respiratory syndrome coronavirus 2.
