Fig. 2.
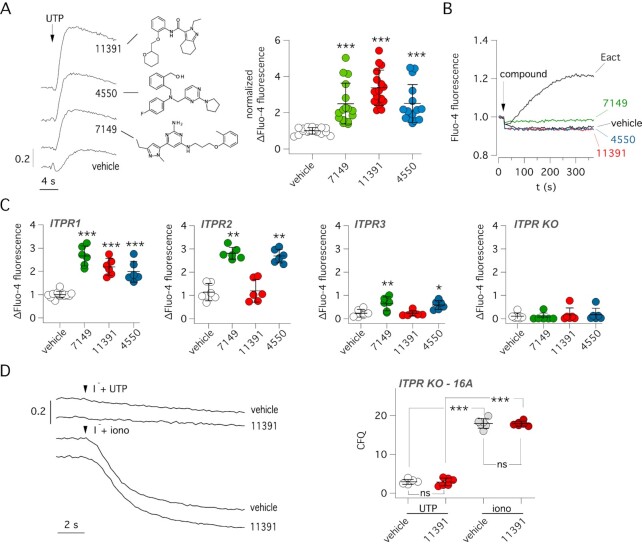
Effect of active compounds on Ca2+ mobilization. (A) Left: representative traces showing effect of 0.25 µM UTP (with/without indicated compounds, 10 µM) on Fluo-4 fluorescence in null FRT cells. The chemical structures of compounds are shown. Right: summary of UTP effect on Fluo-4 fluorescence. The symbols report the normalized maximal change in fluorescence caused by UTP with vehicle or compounds (10 µM). ***, P < 0.001 vs. vehicle (ANOVA with Dunnett's post-hoc test). (B) Representative traces showing the time-course of Fluo-4 fluorescence following acute addition (arrow) of vehicle, indicated compounds from the screening (10 µM), or Eact (5 µM) as a TRPV4 agonist. (C) Summary of data obtained with the Fluo-4 assay in HEK293 cells with selective expression of ITPR1, ITPR2, ITPR3 or totally devoid of ITPR expression (ITPR KO). Ca2+ elevation was induced by UTP. *P <0.05; **P <0.01; ***P <0.001 vs. vehicle (ANOVA with Dunnett’s post-hoc test). (D) Representative traces (left) and summary of data (right) from HS-YFP assay carried out in ITPR-defective HEK293 cells transiently transfected with TMEM16A. Cells were stimulated with 5 µM UTP or 1 µM ionomycin (iono) with/without 10 µM ARN11391. ***P <0.001 (ANOVA with Tukey’s post-hoc test).

