Fig. 4.
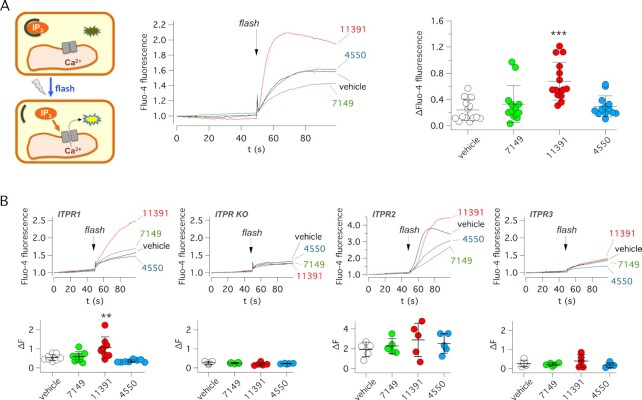
Evaluation of active compounds on ITPR function. (A) Left: scheme of IP3 uncaging experiments. Cells were loaded with ci-IP3/PM and Fluo-4. Ca2+ release from IP3 sensitive stores was elicited with a light flash. Middle: representative traces from experiments on FRT cells showing intracellular Ca2+ increase by ci-IP3 photolysis. Experiments were done in the presence of vehicle or indicated compounds (10 µM). Right: summary of data. Each symbol shows the maximal amplitude of Fluo-4 increase for indicated conditions. ***P <0.001 vs. vehicle (ANOVA with Dunnett's post-hoc test). (B) IP3 uncaging experiments in HEK293 cells with expression of a specific ITPR or totally devoid of ITPR expression (ITPR KO). Top: representative traces. Bottom: summary of data. Each symbol shows the maximal amplitude of Fluo-4 increase for indicated conditions. **P <0.01 vs. vehicle (ANOVA with Dunnett’s post-hoc test).

