Figure 1.
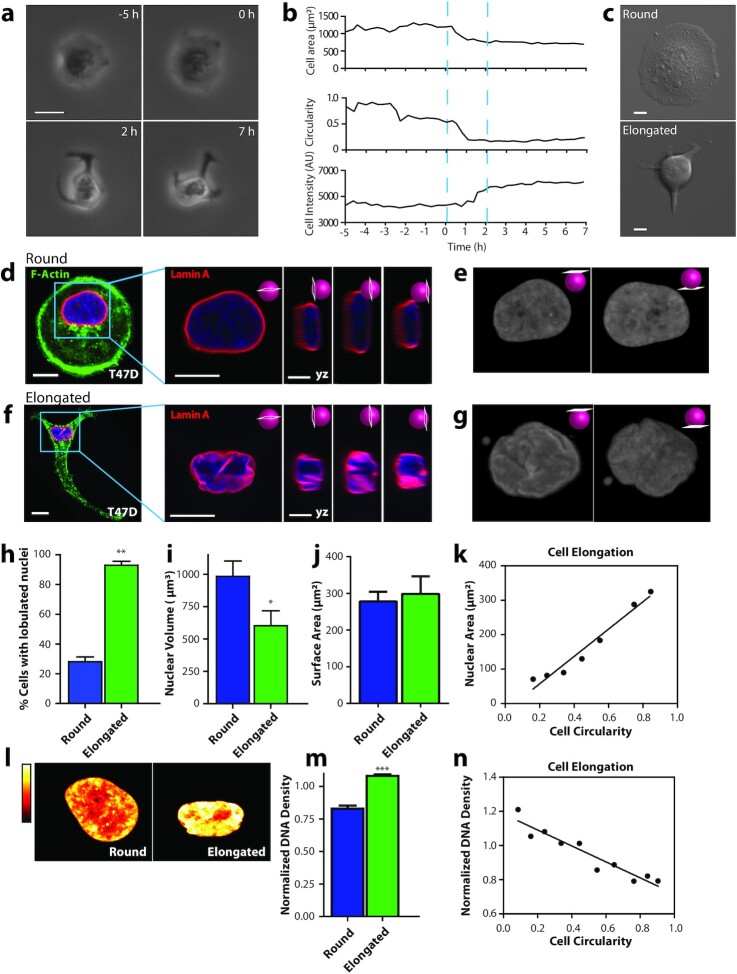
SASP induces changes in cell and nuclear morphology. (a) Phase contrast micrographs of a T47D breast cancer cell undergoing a dramatic change in morphology induced by Sen CM. Scale bar, 20 µm. (b) Changes in cell area, cell circularity, and cell intensity for the cell shown in (a). (c) phase contrast micrographs showing examples of rounded and elongated T47D cells after exposure to Sen CM for 48 h (d and f) Fluorescence confocal micrographs of round (d) and elongated (f) T47D cells stained for F-actin (green), Lamin A (red), and nuclear DNA (blue) after exposure to Sen CM for 48 h. Blue squares indicate zoomed regions of T47D cells. Scale bar, 10 µm. Following panels are zoomed in xy and yz cross-sections of the left panel. These include the xy equatorial cross-section, yx left, equatorial, and right cross section respectively. Scale bar, 5 µm. (e and g) Surface rendering of lamin-A-stained nuclei in panels d and f. The left and right panels indicated top and bottom views of the nuclei, respectively. (h) Percentage of cells of round (blue) and elongated cell morphology with lobulated nuclei 48 h after exposure to Sen CM. Numbers of examined cells are n = 24 and n = 43 for round and elongated cells, respectively. (i) Nuclear volume of cells having round and elongated cell morphology using consequential z-slices; n = 8 and n = 10, respectively. (j) Nuclear surface area of round and elongated cells; n = 8 and n = 10, respectively. (k) Binned correlation between cellular circularity and nuclear area. The blue triangle indicates a decrease in cell circularity from left to right (elongated to round). (l) Intensities of DNA staining were color coded from high to low (white, yellow, orange, red, and black). Condensed regions have higher fluorescence intensity compared to the less condensed regions. (m) Normalized nuclear density between round and elongated cells. Normalization was performed among repeats (n = 87 and n = 157 for round and elongated cells, respectively). (n) Correlation between cellular circularity and normalized DNA density. The blue triangle indicates a decrease in cell circularity from left to right (elongated to round).

