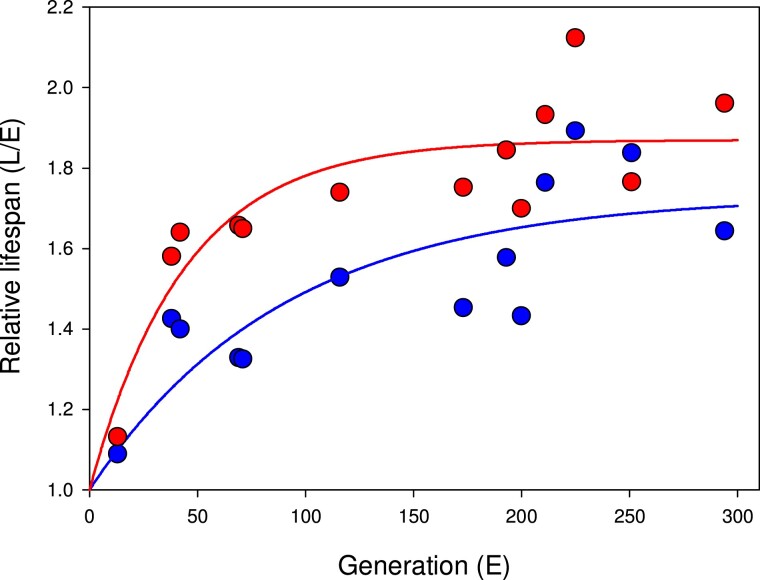
Fig. 1.
The unfolding of sex-specific (females: red; males: blue) divergence in lifespan between the E and L lines over time (mated individuals). Solid lines represent the fitted function Y = 1 + a(1 − bX). Female lifespan evolved more rapidly (b: t = 2.46, P = 0.030) and has reached a greater divergence (a: t = 2.83, P = 0.015) relative to male lifespan divergence. Adult life span was assayed by allowing newly enclosed males and females to mate, and then separating the sexes into petri dishes where life span was monitored by daily spot checks (see Tucić 1996, 1998 for details).

