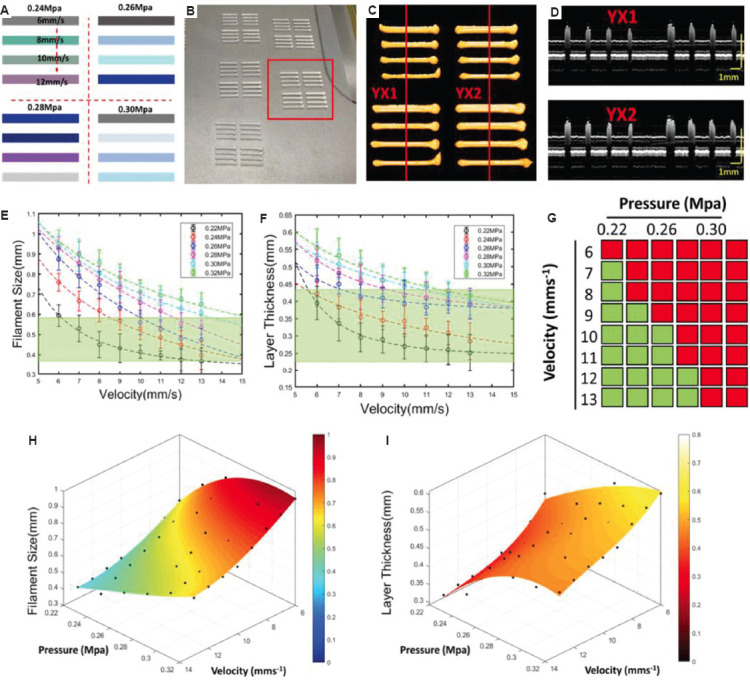
Figure 4.

The pre-experiment for feedback mechanism in the straight path. (A) The designed paths with different input parameters of pressure and velocity. (B) The image of printed results with the inputs in (A). (C) Three-dimensional extrusion-based bioprinter-associated optical coherence tomography (3D P-OCT) result of one group of the printed filaments in (B). (D) The cross-section images corresponding to the red lines in (C). (E) Filament size (FS) measurement results under different pressure and velocity. (F) Layer thickness (LT) measurement results under different pressure and velocity. (G) The acceptability of different combinations of pressure and velocity for the target material, target FS, and LT. Moreover, the green region indicates the acceptable combinations velocity and pressure for the target FS and LT. (H) The surface fitting result of FS. (I) The surface fitting result of LT.
