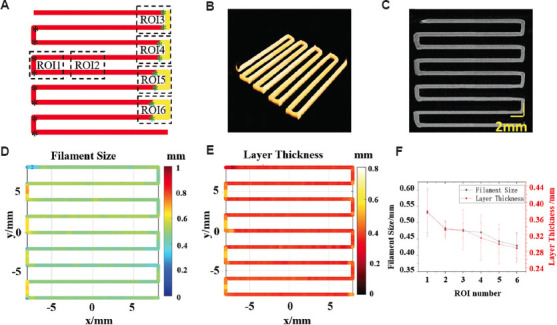
Figure 6.

The pre-experiment for feedback mechanism around the turnarounds. (A) The common path and GCodes around the corners before (the left corners) and after (see ROI 3-6 in the right corners) node adjustment. (B) three-dimensional extrusion-based bioprinter-associated optical coherence tomography (3D P-OCT) result. (C) The enface image of 3D POCT. (D) Filament size (FS) distribution of (B). (E) Layer thickness (LT) distribution of (B). (F) Average FS and LT values in different regions with different input parameters.
