
Figure 5.
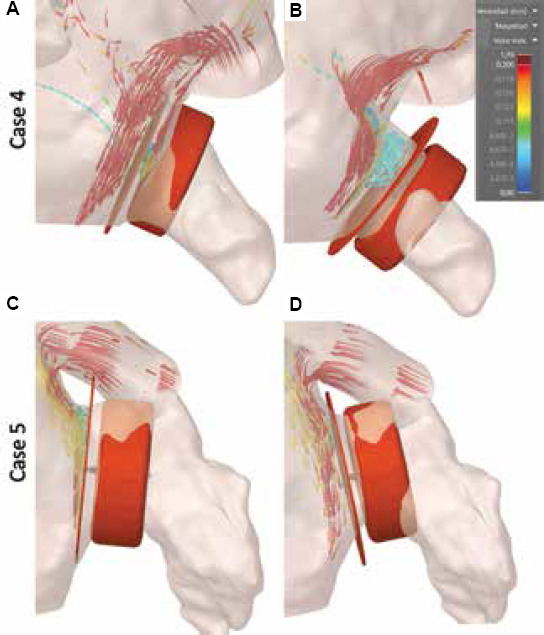
(A-D) Examples of in silico fluid simulations using Ansys Discovery Live with optimal device settings according to a given participant. 3D streamline-based visualization simulations were used to illustrate blood flow patterns of in the left atrium and left atrial appendage. Blue and red represent low velocity (< 10 m/s) and high velocities (> 20 m/s), respectively.