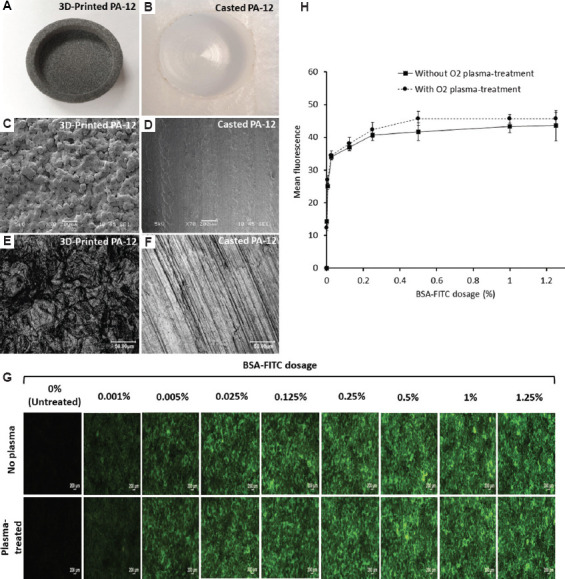
Figure 1.

Picture of a (A) 3D-printed PA-12 and (B) casted PA-12 cell culture chamber. Scanning electron microscopy images showing the surface morphology of (C) 3D-printed PA-12 and (D) pure casted PA-12, respectively (scale bar: 200 μm). Representative confocal scanning microscopy images displaying the surface roughness of (E) 3D-printed PA-12 and (F) pure casted PA-12, respectively (scale bar: 50 μm). (G) Fluorescence microscopy images of increasing concentrations of BSA-FITC conjugate bound on 3D-printed PA-12 substrates with and without O2 plasma-treatment. (H) Standard curve showing fluorescence signal quantification of BSA-FITC bound to 3D-printed PA-12 substrates with and without O2 plasma-treatment.
