Figure 4.

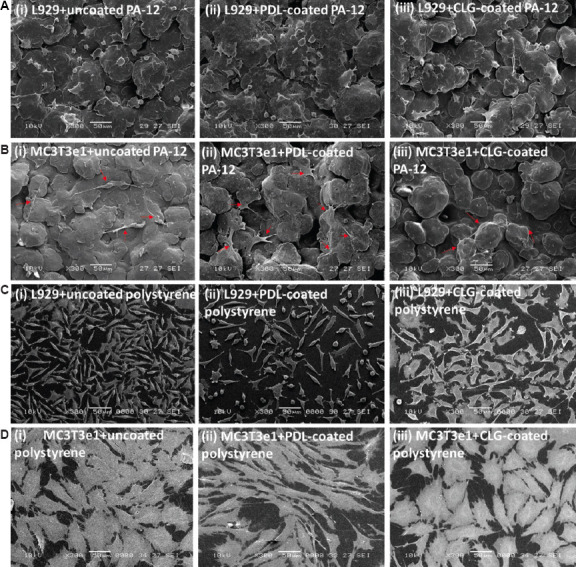
Representative scanning electron microscopy images showing the morphology of (A) L929 fibroblasts and (B) MC3T3e1 osteoblasts cells cultured on (i) uncoated, (ii) PDL-coated, and (iii) CLG-coated 3D-printed PA-12 cell culture chambers after 4 days of culture. The red arrows are used to specify the location of the cells. Representative scanning electron microscopy images showing the morphology of (C) L929 fibroblasts and (D) MC3T3e1 osteoblasts cells cultured on (i) uncoated, (ii) PDL-coated, and (iii) CLG-coated polystyrene cell culture chambers after 4 days of culture.
