Figure 5.

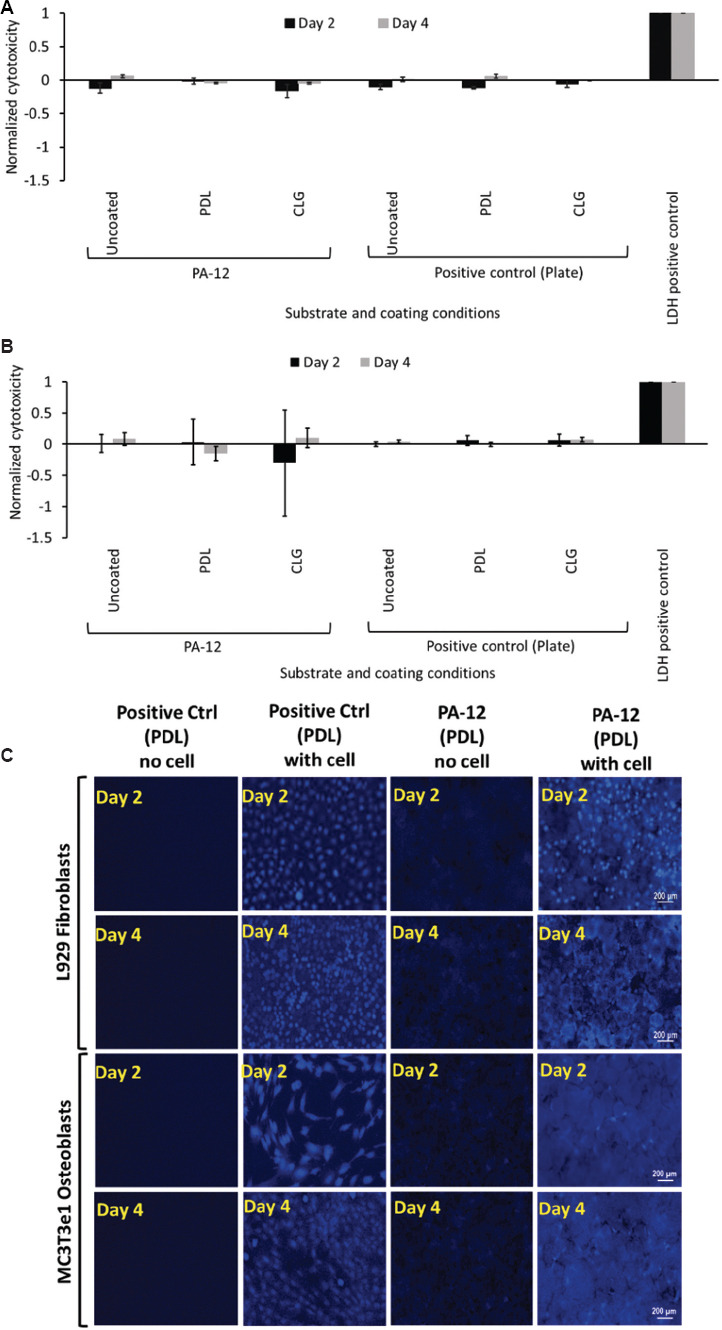
Graph of LDH release from (A) L929 fibroblasts and (B) MC3T3e1 osteoblasts cultured on uncoated, O2 plasma-treated, PDL- and CLG-coated 3D-printed PA-12, and positive control (plate) cell culture chambers after day 2 and day 4, respectively. LDH released from each sample was normalized with endogenous LDH released by lysis to obtain the normalized cytotoxicity. A positive control of pure LDH was included as a reference with a value fixed at 1. (C) Representative fluorescence microscopy images of L929 fibroblasts and MC3T3e1 osteoblasts stained for glutathione evaluation following culture on PDL-coated 3D-printed PA-12 and positive control (plate) cell culture chambers after day 2 and day 4, respectively.
