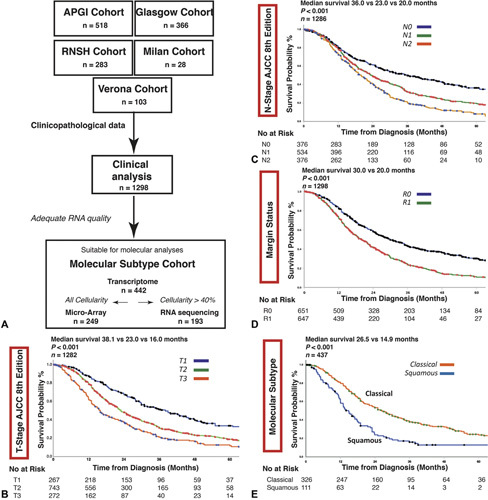
Figure 1.

A, Transcriptomic profiling strategy of the molecular subtype cohort. Transcriptomic analysis was performed using either RNA sequencing (RNAseq) or gene expression microarray based on cellularity and adequate RNA quality of the sample in a selection (n = 442) of PDACs. Tumor cellularity >40% allowed whole genome sequencing, whilst RNAseq was performed in tumors with sufficient cellularity (>40%) and quality RNA. Kaplan-Meier survival curves for all patients stratified by AJCC 8th edition staging criteria for B) T-stage, C) N-stage, and D) margin status and E) molecular subtype.
