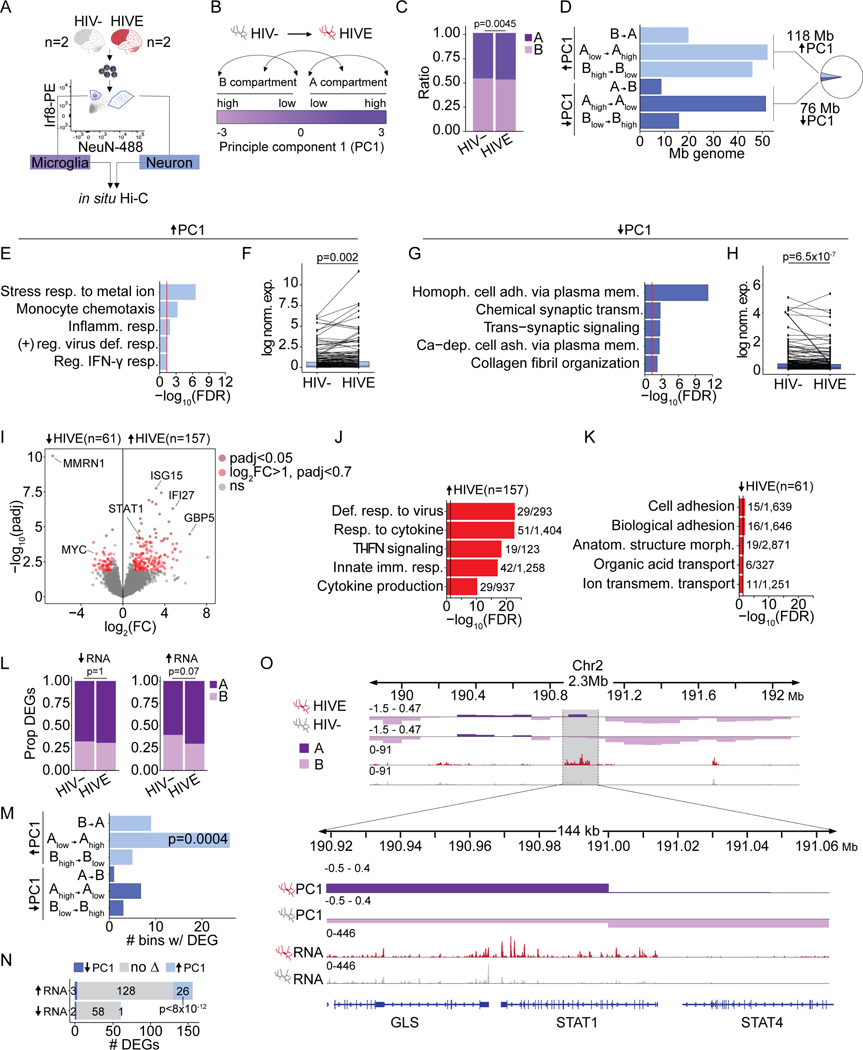
Figure 2. Chromosomal compartment remodeling and transcriptomic alterations in HIVE microglia.
(A) Representative FANS plot for sorted NeuN+/neuronal and Irf8+/microglia nuclei for in situ Hi-C. (B) Schematic A/B Hi-C compartment designation based on the eigenvector value of principle component 1 (PC1). Arrows illustrate the different classes of compartment switches between HIVE and HIV- microglia. (C) Bar plot, proportion of genome in A/B compartments in HIV- and HIVE microglia (P, chi-square). (D) Bar graph summarizing dcHiC genome-wide compartment remodeling in HIVE vs. HIV- microglia. X-axis shows Mb of genome undergoing the compartment switches indicate on the Y-axis. A-compartmentalization (ΔPC1 HIVE-HIV- >0, FDR<0.05) shown in light blue; B-compartmentalization (ΔPC1 HIVE-HIV- <0, FDR<0.05) in dark blue. Inset pie chart shows the total percent of significant A- and B- compartmentalization in the genome. (E, G) Gene ontology enrichments and (F, H) differential expression for genes undergoing A-compartmentalization (E,F) or B-compartmentalization (E,F) in HIVE as compared to HIV- microglia. (F, H) Paired line plots showing average log normalized expression of genes in compartments with significant PC1 increase in HIVE microglia. For visualization, randomly selected subsets of 200 genes are shown. P-value reflects Wilcoxon signed rank test across all genes with expression levels > 25th percentile in either HIV- or HIVE microglia; (F) n=1030, (H) n=566. (I) Volcano plot, -log10(adjust p-value) (Y-axis) and log2(Fold Change) (X-axis) for snRNA-seq differential expression of the microglial cluster (Figure 1C, Mg) from n=3 HIV- and n=7 HIVE brains. Dark red dots mark genes with padj<0.05. Light red dots, genes with log2(FC)>1 and padj<0.7. (J-K) Biological process GO enrichment for up- (J) and downregulated (K) genes with N dataset genes/total GO category genes indicated. Vertical black line marks significance FDR=0.05. (L) Proportion of up- or downregulated microglial DEGs in A and B compartments. P, chi-square. (M) Bar plot, x-axis marks number of 10kb bins undergoing compartment switching that contain a DEG. P, Fisher’s exact test compared to the proportion of the whole genome that underwent the indicated compartment switch. (N) Overlap between up- and downregulated DEGs in HIVE vs. HIV- microglia and all genes that underwent compartment switching. P, hypergeometric test, representation factor 35. (O) Representative browser shot of 144kb window on chromosome 2, showing STAT1/STAT4 gene locus with Hi-C PC1 eigenvector value (top two tracks) at a 10kb resolution, and snRNA-seq normalized read counts for the Mg cluster (bottom two tracks). See also Figures S2, S3 and S5.

