
Figure 4. Learning rate asymmetries and task performance.
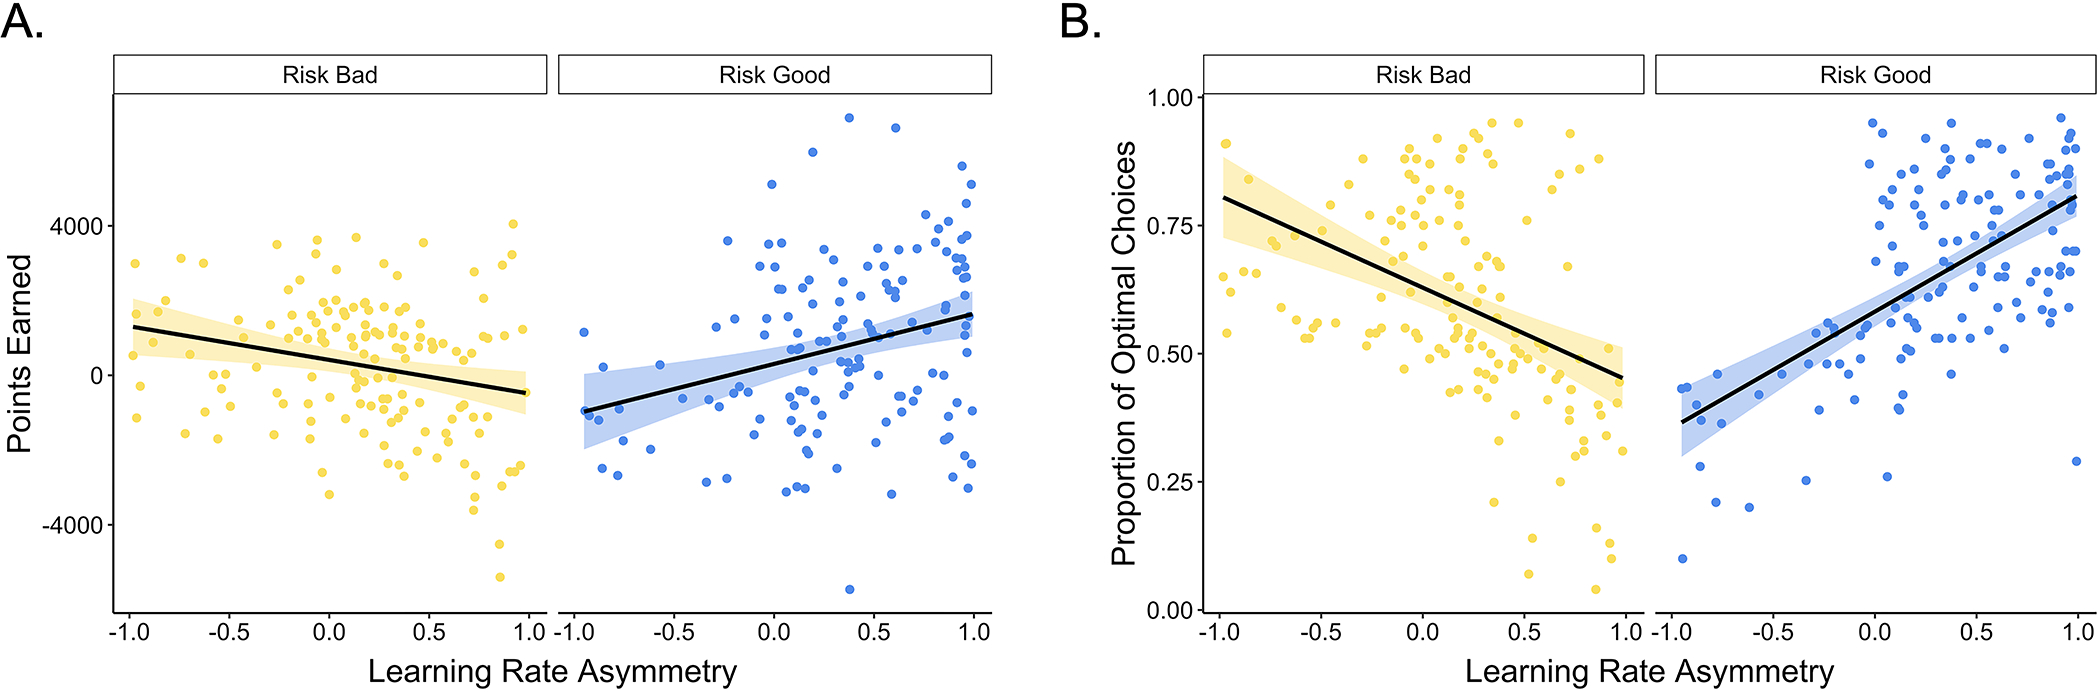
Participants with more negative learning rate asymmetries in the risk bad block (A) earned more points and (B) made more optimal choices, whereas the reverse was true in the risk good block (p < .001). The points represent individual participants’ asymmetry indices for each block. The black lines show the best-fitting linear regression lines for each block, and the shaded region around them represents the 95% confidence interval.