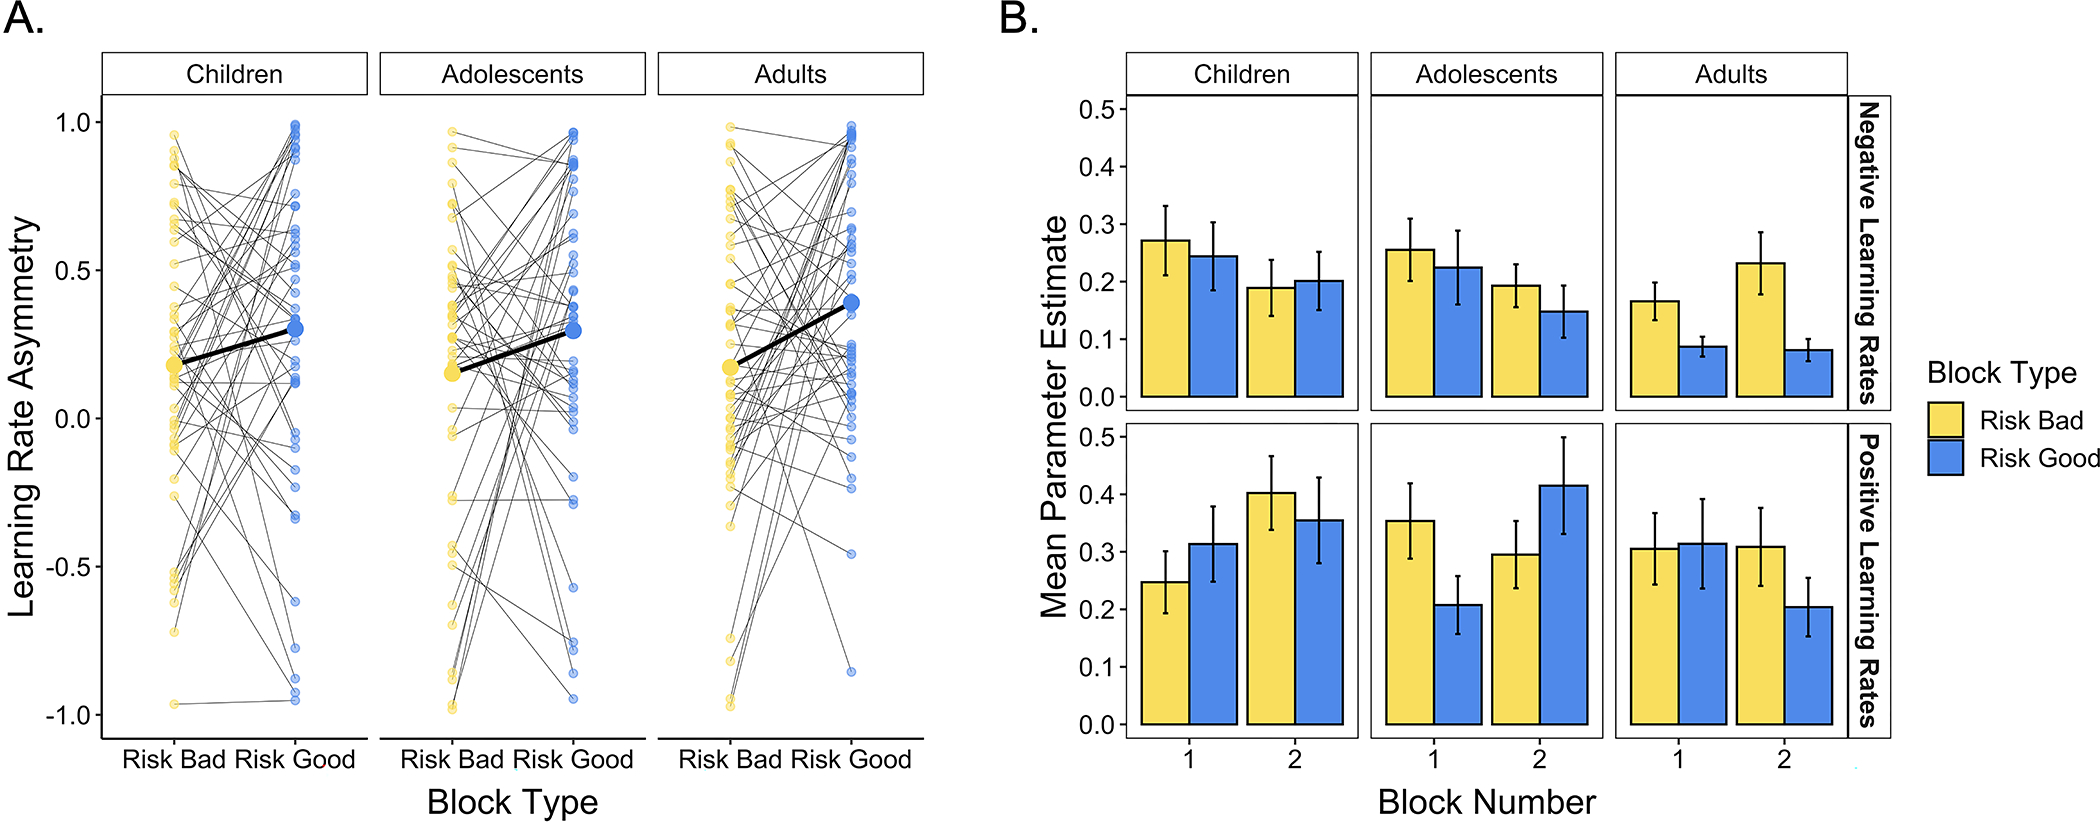
Figure 5. Learning rates across blocks.

(A) Participants demonstrated more positive learning rate asymmetries in the risk good relative to the risk bad block (p = .007). The smaller dots represent individual participants’ learning rate asymmetries in each block; think black lines connect points belonging to the same participant. The larger points connected by the thicker black lines indicate means within each age group. (B) Differences in learning rate asymmetries across blocks were largely driven by differences in participants’ negative learning rates. Participants demonstrated significantly higher negative learning rates in the risk bad relative to the risk good block (p = .022). Positive learning rates did not significantly vary across block types (p = .519).
