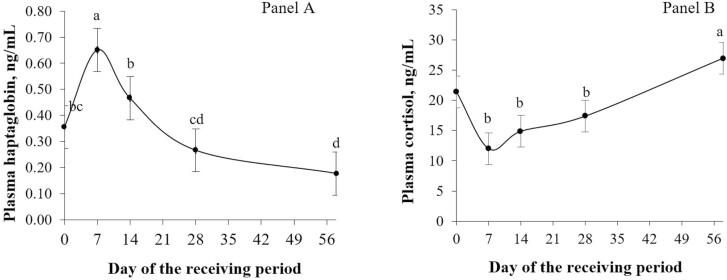
Figure 3.
Effect of day of sampling (P < 0.001) on plasma haptoglobin (SEM = 0.067; panel A) and cortisol (SEM = 1.63; panel B) concentration (ng/mL) of newly received feedlot calves. Samples were collected on days 0 (feedlot arrival), 7, 14, 28, and 58. Means with different superscripts differ across sampling days (P ≤ 0.05). For plasma concentration of cortisol (panel B), day 0 values were used as a covariate, and it is included in this graph just as a reference for the initial concentration.

