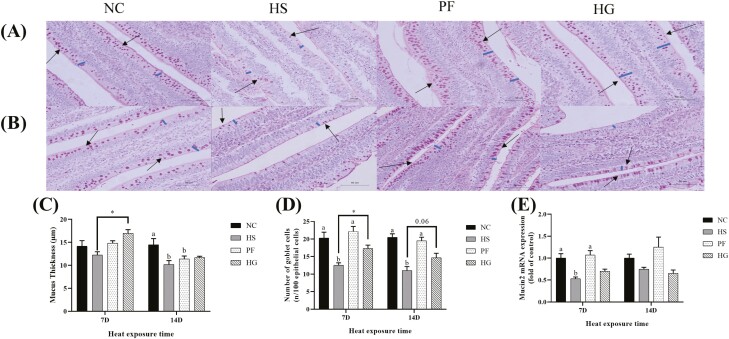
Figure 3.
Guanidinoacetic acid (GAA) attenuated heat stress (HS)-induced damage of the mucous layer. (A) Hematoxylin and eosin staining after 7 d thermal exposure. (B) Hematoxylin and eosin staining after 14 d thermal exposure. The blue marks in (A) and (B) indicate intestinal mucus thickness; the arrows in (A) and (B) indicate the stained goblet cells. Mucus thickness (C), the number of jejunal goblet cells (D) and the mRNA expression level of Mucin2 (E). Data were represented as the means ± SE. a,bMeans within a row without a common superscript differ remarkably among the NC, HS, and PF groups (P < 0.05). *Indicates a significant difference between HS vs. HG (P < 0.05). NC, normal control group, 22 °C, ad libitum feed basal diet; HS, heat stress group, 32 °C, ad libitum feed basal diet; PF, pair-fed group, 22 °C, received food equivalent to that consumed by the HS group on the previous day; HG, guanidinoacetic acid group, 32 °C, ad libitum feed basal diet with 0.6 g/kg guanidinoacetic acid.

