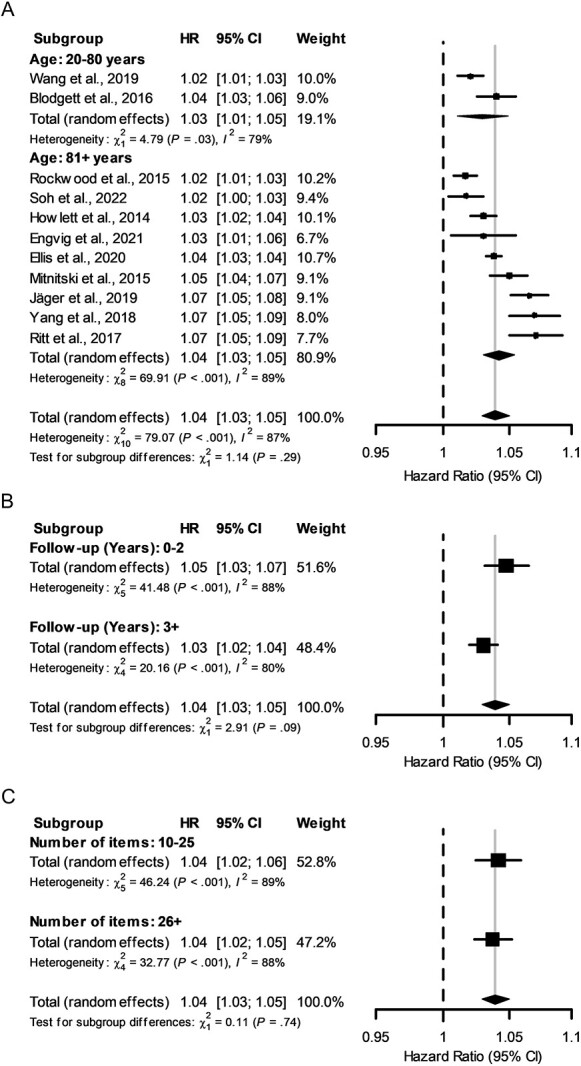
Figure 2.

Forest plots of mortality risk by HR according to a 0.01 increase in frailty measured by the FI-Lab. All forest plots used HRs from all studies included in the mortality subgroup meta-analysis. Data are presented on a log10 scale, the dashed-vertical line represents no effect, and the solid-vertical line indicates the overall effect of all studies. (A) HR for all studies in the mortality subgroup. The mean age analysis is also represented with the respective effects of each age grouping. (B) Analysis separated by follow-up time. (C) Analysis separated by number of items measured.
