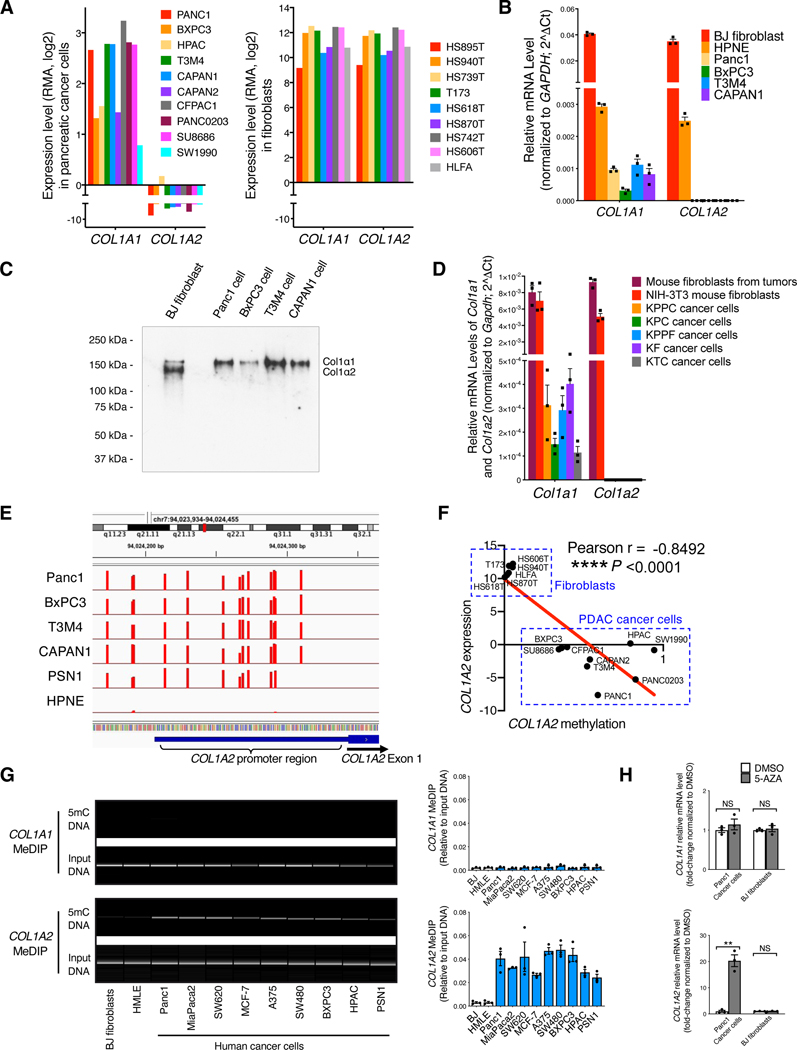
Figure 1. Pancreatic cancer cells express only COL1A1 (forming α1/α1/α1 homotrimer) but not COL1A2 due to COL1A2 promoter hypermethylation.
(A) The expression levels of type I collagen (Col1) genes: COL1A1 (encoding Col1 α1 chain) and COL1A2 (encoding Col1 α2 chain) in human pancreatic cancer cell and fibroblast lines based on RNA-seq data from the CCLE database. RMA (Robust Multi-array Average algorithm) normalization was used and data were presented as the log2 gene expression.
(B) The expression levels of COL1A1 and COL1A2 in human cell lines by qRT-PCR. Human BJ fibroblast, normal human pancreatic epithelial cell line (HPNE), and pancreatic cancer cell lines were examined (n = 3).
(C) Detection of purified Col1 (human Col1α1 and/or Col1α2 chains) from conditioned culture media of human cell lines by Western blot. Representative Western blot of three independently experiments was shown.
(D) The expression levels of Col1a1 and Col1a2 in primary pancreatic cancer cell lines from indicated mouse models, as compared to mouse fibroblasts (n = 3).
(E) Genome-wide DNA methylation analysis of human pancreatic cancer cell lines and HPNE cell line (n = 3). DNA methylation at COL1A2 gene promoter regions was shown. Methylation percentages of the individual CpGs examined are depicted as bars (with Y axis ranging from 0 to 100) at their genome.
(F) The reverse correlation between COL1A2 expression level and COL1A2 methylation fraction in human pancreatic cancer cells and fibroblasts based on the RNA-seq and DNA methylation data from the CCLE database. Pearson’s correlation test was used.
(G) Methylated DNA immunoprecipitation (MeDIP) assay of COL1A1 and COL1A2 genes in various human cancer cell lines, as compared with BJ fibroblasts (n = 3).
(H) The expression of COL1A1 and COL1A2 in human cancer cells and fibroblasts treated with 5-azacytidine (5-AZA; 10 μg/mL) for 14 days (n = 3).
Data are represented as mean ± SEM. **p < 0.01, ****p < 0.0001; NS: not significant, Student’s t test was used unless otherwise indicated. All experiments were conducted in triplicate.
See also Figure S1.

