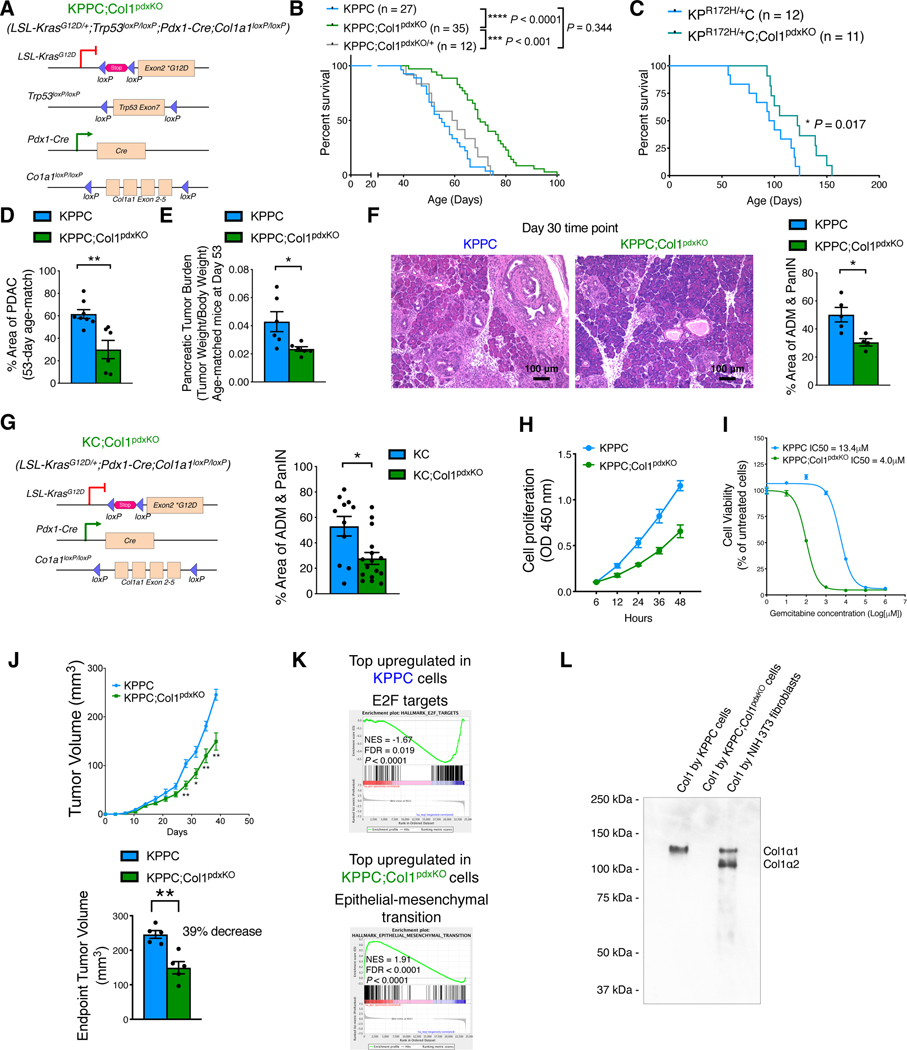
Figure 2. Deletion of Col1 as the α1/α1/α1 homotrimer format in pancreatic cancer cells delays PDAC progression.
(A) Genetic strategy to delete Col1α1 (Col1a1) in pancreatic cancer cells using the KPPC;Col1pdxKO mice, as compared to background-matched KPPC mice.
(B) Survival of KPPC (n = 27), KPPC;Col1pdxKO (n = 35), and KPPC;Col1pdxKO/+ (heterozygous Col1a1 deletion, n = 12) mice. Log-rank (Mantel-Cox) test was used.
(C) Survival of KPC;Col1pdxKO (n = 11) mice, as compared to background-matched KPC (n = 12) mice. Log-rank (Mantel-Cox) test was used.
(D) Histology evaluation of tumors from KPPC (n = 8) and KPPC;Col1pdxKO (n = 6) mice at the same age of 53 days.
(E) Pancreatic tumor burden (tumor weight/body weight) of KPPC (n = 6) and KPPC;Col1pdxKO (n = 6) mice at the same 53 days of age.
(F) Percentage of ADM/PanIN lesion areas of KPPC (n = 5) and KPPC;Col1pdxKO (n = 4) mice at the same 30 days of age. Scale bar: 100 μm.
(G) Genetic strategy to delete Col1a1 in cancer cell lineage in the context of pancreatic cancer using the KC;Col1pdxKO mice, as compared to background-matched KC mice. Percentage of ADM/PanIN lesion areas was quantified based on H&E sections from KC (n = 11) and KC;Col1pdxKO (n = 16) mice.
(H) Cell proliferation of KPPC and KPPC;Col1pdxKO cell lines over time (n = 3 biological replicates).
(I) Cell viability of KPPC and KPPC;Col1pdxKO cell lines (% normalized to untreated group of each cell line) treated with gemcitabine (n = 3).
(J) Xenograft tumor formation of KPPC and KPPC;Col1pdxKO cancer cell lines subcutaneously in nude mice (n = 5/group).
(K) Gene set enrichment analysis (GSEA) of RNA-seq data on KPPC and KPPC;Col1pdxKO cancer cells. Top upregulated pathways were shown. NOM. p. val: nominal P value. NES, normalized enrichment score. FDR, false discovery rate (q value).
(L) Detection of purified Col1 (mouse Col1α1 and/or Col1α2 chains) from conditioned culture media of mouse cancer cells or fibroblasts. Representative Western blot of three independently experiments was shown.
Data are represented as mean ± SEM. *p < 0.05, **p < 0.01, ***p < 0.001, ****p < 0.0001, Student’s t test was used unless otherwise indicated.
See also Figures S1–S3; Table S1.

