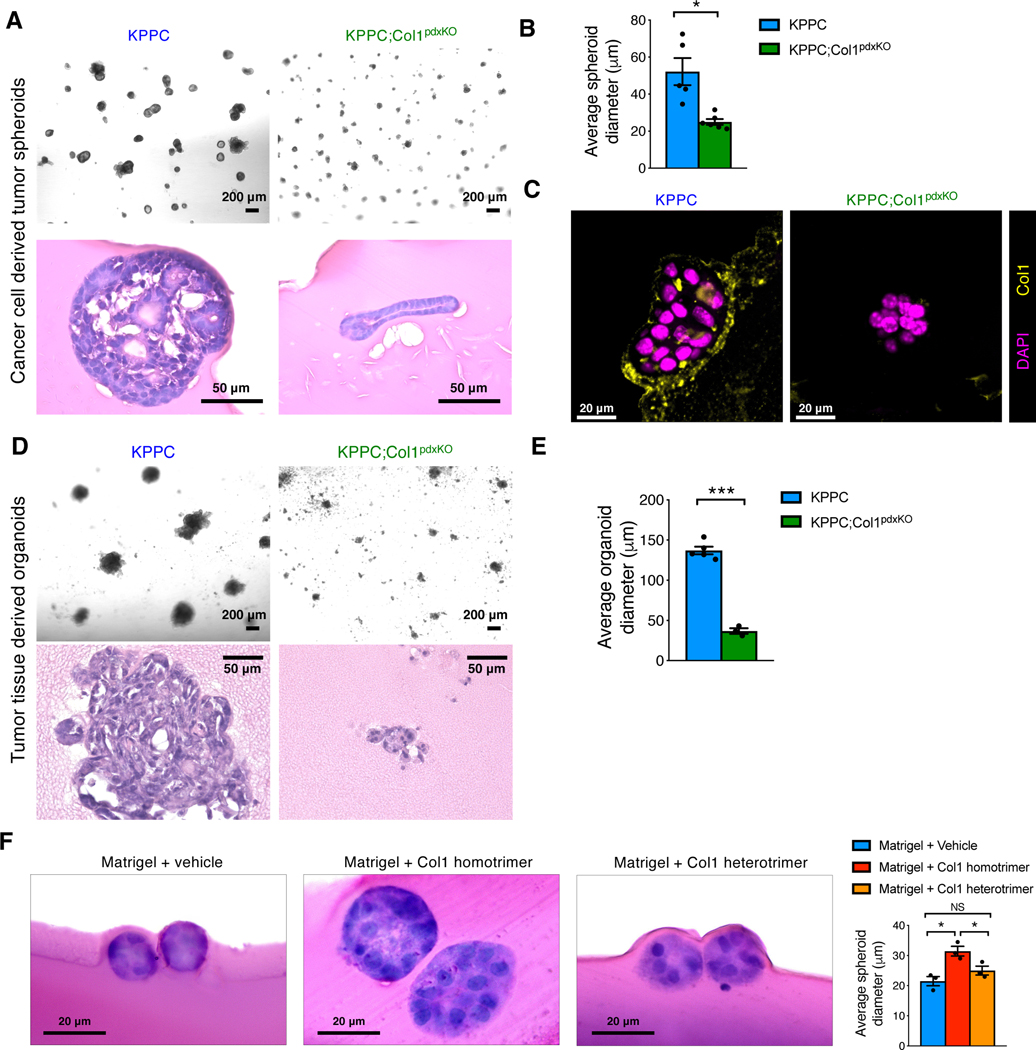
Figure 3. Deletion of oncogenic Col1 homotrimers impedes the proliferation and tumorigenesis of pancreatic cancer cells.
(A-C) 3D tumor spheroids established from KPPC and KPPC;Col1pdxKO cancer cell lines (n ≥ 5 biological replicates). Tumor spheroids were subjected to H&E (A and B) and Col1 staining (C). Average diameter of spheroids was quantified in (B). Scale bar for tumor spheroids: 200 μm. Scale bar for H&E staining: 50 μm. Scale bar for immunofluorescence staining: 20 μm.
(D and E) Organoids were established from fresh tumor mixtures of KPPC (n = 5) and KPPC;Col1pdxKO (n = 3) mice (D), and quantified for average diameter (E). Scale bar: 200 μm in 3D culture images; 50 μm in H&E images.
(F) Tumor spheroids established from KPPC;Col1pdxKO cells grown in 3D Matrigel culture system supplemented with Col1 homotrimers or Col1 heterotrimers (n = 3/group). Tumor spheroids were subjected to H&E staining. Scale bar for H&E staining: 20 μm.
Data are represented as mean ± SEM. *p < 0.05, ***p < 0.001; NS: not significant, Student’s t test was used.
See also Figure S3.

