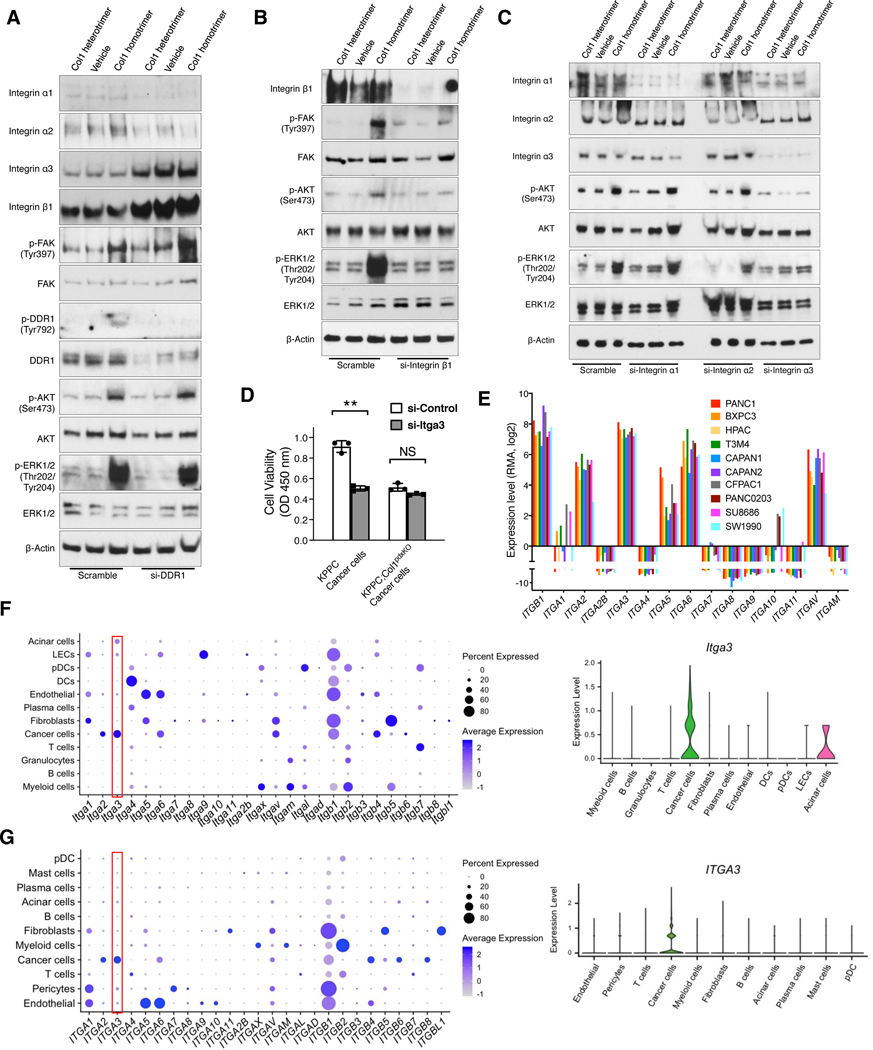
Figure 5. Col1 homotrimer-induced signals involve integrin α3(β1) that is specifically expressed by pancreatic cancer cells.
(A-C) KPPC;Col1pdxKO cancer cells were transfected with siRNAs of DDR1 (A), integrin β1 (B), integrin α1, integrin α2, or integrin α3 (C). Cells were treated with Col1 homotrimers or heterotrimers for 16 hours. Cells were examined by Western blotting. Representative Western blot of three independently experiments was shown.
(D) KPPC and KPPC;Col1pdxKO cancer cells were transfected with siRNA of integrin α3. Cells were then cultured for 48 hours and examined by cell viability assay (n = 3). Data are represented as mean ± SEM. **p < 0.01; NS: not significant, Student’s t test was used.
(E) Expression levels of selected integrin subunits in human PDAC cell lines based on RNA-seq data from the CCLE database. RMA normalization was used and data were presented as the log2 gene expression.
(F and G) Expression profile of Itga3 (F) and ITGA3 (G) among various cell clusters from the single-cell RNA-sequencing datasets of mouse (GEO: GSE166298) and human (GSA: CRA001160) pancreatic tumors, as shown in dot plot and violin plot.
See also Figure S4.

